
Hi there! Bjork here, checking in for the monthly income and traffic report.
Every month I put together a post detailing the income and traffic from the previous month. In these reports I also include tips about the things that Lindsay and I are learning about growing a food blog. Our hope with these reports is that you can learn something new and apply it to your own blog.
We started this journey back in August 2011. None of this happened overnight. Growing a blog to the point of creating a decent income is a lot of work. There have been countless failures and frustrations along the way, and we are consistently battling something that author and speaker Seth Godin calls “the resistance.”
“The resistance is the voice in the back of our head telling us to back off, be careful, go slow, compromise. The resistance is writer’s block and putting jitters and every project that ever shipped late because people couldn’t stay on the same page long enough to get something out the door.
The resistance grows in strength as we get closer to shipping, as we get closer to an insight, as we get closer to the truth of what we really want. That’s because the [the resistance] hates change and achievement and risk.”
Seth Godin
Do you know that feeling? If you do, you’re not alone. Lindsay and I are right there with you.
What’s the solution for conquering the resistance? There isn’t one. It’s a constant battle. One that needs to be fought daily. Sometimes we win, sometimes we don’t. The key is to continually push back against it. Keep creating. Keep experimenting. Keep keeping on.
So, let’s go ahead and do that by jumping into this month’s report. I’ll be sharing the usual numbers, some new information (Pinch of Yum’s monthly expenses), and some updates on changes we’ve recently made.
Income
- BlogHer – $2,247.83
- Tasty Food Photography – $1,342.00
- Bluehost – $910
- Google AdSense – $650.69
- Thesis Theme – $205.26
- Elegant Themes – $58.50
- CPM Only – $56.10
- Lijit Networks – $51.68
- Amazon Affiliate Program – $38.42
- Ziplist Recipe Box – $16.06
- CrashPlan – $9.00
Total Income:: $5,242.54
Expenses
- Media Temple (Hosting) – $350
- Tasty Food Photography Affiliates – $334
- Web Designer – $247.50
- Web Optimization Round 2 – $240.00
- Food Expenses- $207.40
- Amazon S3 and Cloudfront– $174.29
- Web Optimization Round 1 – $150.00
- PayPal Transaction Percentage – $65.81
- PayPal Website Payments Pro – $60
- Genesis Theme – $59.95
- Adobe Creative Cloud – $32.13
- VaultPress – $15
- E-Junkie – $15
Total Expenses: $1951.08
Net Profit: $3,291.46
If you’re interested in learning more about some of the ways that you can monetize a food blog, we encourage you to download this free ebook, “16 Ways to Monetize Your Food Blog,” from our sister site, Food Blogger Pro!
Thoughts On Income
You’ll notice a big change in this month’s report: expenses. Seeing as to the fact that these posts are focused on the “business of blogging,” I thought that expenses would be an important element to include.
This month’s biggest expense was hosting. We upgraded to the next level of hosting with MediaTemple in order to help the resource usage issues we were having after updating the design of the blog. The upgraded plan is $200 more a month then the previous plan. It’s a bit of a bummer to be spending more, but it’s necessary in order to maintain a decent load time. Let me know if you have any other questions about the expenses. I’d be happy to explain them.
We’ve started the process of experimenting with other advertisers, so you’ll see that the income list includes Lijit and CPMOnly. We don’t have enough data to come to any solid conclusions yet, but we’ll be sure to keep you in the loop. We currently have Lijit running as the main sidebar ad, and when there aren’t any ads that Lijit can run we show Google Adsense.
Have you used Lijit or CPMOnly before? How’s your experience been?
Traffic Breakdown
Below are some screenshots from Google Analytics. You can click on these screenshots to view a larger image.
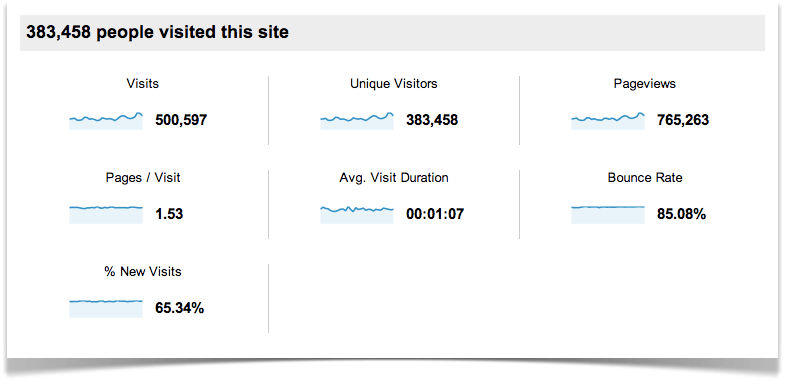
Traffic Overview
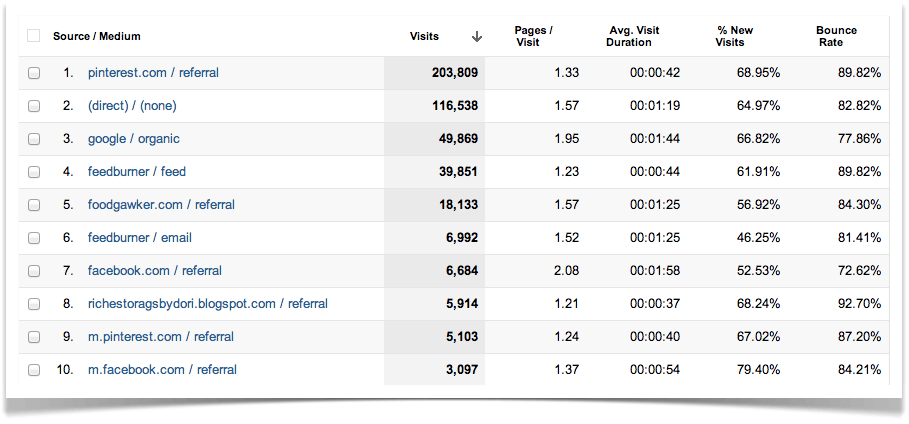
Top Ten Traffic Sources
Thoughts on traffic
Traffic was almost exactly the same in April as it was in March. However, there were two metrics that I was really excited to see change: pages per visit and average visit duration.
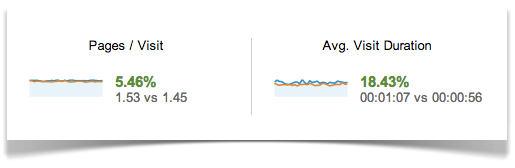
At first glance the changes don’t seem that significant, as page views increased by .08 and average visit duration increased by 11 seconds. However, the percentage increase helps to put that in perspective. Page views increased by almost 5.5% and average visit duration increased by almost 18.5%. While it’s impossible to know for sure, I would assume that the increase with those numbers can be attributed to the fact that the site is now mobile responsive.
Working with Brands
In last month’s report I updated everyone on my dismal progress with connect with brands. In one month I had connected with one brand. The response I received was warm, but nothing ended up developing from it.
I quickly realized that between Food Blogger Pro, my “regular” job, and my work with the Children’s Shelter of Cebu, that I personally wouldn’t be able to reach out and connect with brands on a regular basis.
So, what then?
Enter the Sway Group.
Sway will fill the gap that I couldn’t. They have super savvy folks that work to connect brands to Pinch of Yum and handle all of the details that go into the partnerships.
Exactly. What. We. Need.
We’re honored to be a part of Sway’s roster. As mentioned above, it’ll be nice to be able to continue to focus on creating great content and let Sway handle the brand partnerships.
Bluehost Links and Changing Color
Bluehost is the hosting company that we recommend to new food bloggers on our how to start a food blog page. The affiliate income from Bluehost has almost always been in the top five on the income reports. Before we redesigned Pinch of Yum we were consistently getting 600-800 clicks on the Bluehost affiliate links, but after the redesign it immediately dropped to half of what it used to be.
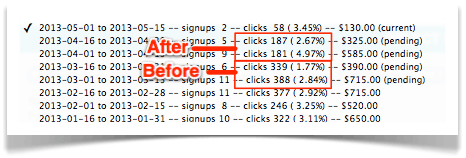
So I decided to put my thinking cap on and do some investigation. I wanted to see if I could figure out what the issue was. I first took a look at the traffic numbers to see if the amount of traffic to the page had dropped.
In Google Analytics, I compared the March numbers to the April numbers on the how to start a food blog page.
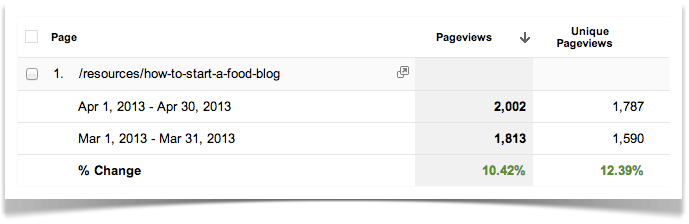
As you can see, I found that traffic actually went up. Hmmm… If traffic went up, but total clicks went down, then that means that people are just flat out clicking less. Why though? Well, I did some research and came across this video from Social Triggers, which I think sums up the exact issue we were having with our redesign.
This is the part that really stood out to me:
“What stands out gets clicked. What blends in gets ignored.”
That was the issue. All of the links on Pinch of Yum were blending in. This resulted in a drastic decrease in the click through rate (CTR). I decided to make the change right away.
- Here’s an example of what a link looked like before.
- Here’s an example of what it looks like now.
Do you see how big of a difference that makes? I’m guessing this change will result in an increased CTR. I’ll report back next month to let you know for sure.
Thanks!
I’ve said it before, but I’ll say it again: Thank you!
If not for you this blog wouldn’t exist. It really means a lot to us that you come and read the posts, leave comments, or drop an email to say hi.
Until next time, cheers!
The post April Traffic and Income Report – $3,291.46 appeared first on Pinch of Yum.