Hi there!
Bjork here checking in for Pinch of Yum’s monthly traffic and income report.
We’re playing a little catch up with these reports, so this one is coming out just two weeks after July’s report.
We’ve been publishing these traffic and income reports for over five years, which means this is post #61. You can see all of the past posts here. Before that, Lindsay had been blogging for a year and a half. Add it up and you’ll find that we’ve been working on Pinch of Yum for almost seven years.
I mention those numbers because it’s important to understand how long we’ve both been working on this. It’s taken a lot of time, energy, focus, and luck.
The day-to-day isn’t very sexy. It’s lots of time on the computer: email, Slack, accounting, photo editing, communicating with brands, communicating with readers, social media, developing recipes, etc, etc, etc…
We’re extremely grateful for the opportunities that Pinch of Yum and Food Blogger Pro have provided us, and at the same time we’re extremely careful not to paint a picture of something that this is not. It’s not a four hour work week, it’s not working from beaches, and it’s not automated income.
It’s awesome work if you like it, but it’s definitely work.
The good news is that the platform that we’ve built this on (the internet!) doesn’t have restricted access. If you’re reading this, then you have the tools you need to get started. The cost of entry is insanely low. You can press publish. You can create content. You can share your passion and build a following and impact the way others think about the world.
Is it an overnight miracle? No.
Is it possible? 100%.
Our goal with these reports is to show you the nitty-gritty details of how we’re navigating the path to build “our thing” in hopes that it encourages you to build “your thing,” whatever that might be. Our friends and family can tell you – we’re passionate and excited about people getting to work on the things that they’re passionate and excited about.
Let’s jump into the numbers for August…

Note: Some of the links below are affiliate links. All of the products listed below are products and services we’ve used before. If you have any questions about any of the income or expenses you can leave a comment and we’ll do our best to reply.
Income
- AdThrive – $29,204.84
- Sponsored Content – $7,350.00
- AdThrive Video – $5,973.04
- Bluehost – $4,140 –> this income comes from a page where we show people how to start a food blog in three steps.
- Amazon Associates – $2,974.12
- Tasty Food Photography – $2,772.40
- Swoop – $2,514.83
- Gourmet Ads – $1,873.26
- sovrn – $443.93
- Federated Media – $373.47
- Genesis Theme – $291.99
- How to Monetize Your Food Blog eBook – $280.00
- Elegant Themes – $224.00
- ActiveCampaign – $35.13
- AWeber – $14.40
Expenses
- Justworks and Contractors – $13,767.19
- Studio Related Expenses – $4,080.57
- Food Expenses – $884.56
- eBook Affiliates – $633.35
- ActiveCampaign – $415.00
- Slack – $410.00
- Video Related Expenses – $355.00
- Insurance – $263.82
- PayPal Transaction Percentage – $179.73
- Adobe Creative Cloud – $107.43
- LeadPages – $67.00
- Travel – $65.04
- Audible – $61.73
- Zapier – $50.00
- PayPal Website Payments Pro – $30.00
- Shoeboxed – $29.95
- Hotjar – $29.00
- E-Junkie – $28.00
- QuickBooks – $26.95
- VaultPress – $20.00
- Amazon S3 and Cloudfront – $26.84
- GitHub – $25.00
- CloudFlare – $20.00
- SumoMe – $20.00
- ViralTag – $18.00
- Hello Bar – $15.00
- Pingdom – $14.95
- Backupify – $12.00
- Buffer – $10.00
- Dropbox – $9.99
- CrashPlan – $9.99
- Link In Profile – $9.99
- BoardBooster – $5.00 (Update: BoardBooster has shut down)
If you’re interested in learning more about some of the ways that you can monetize a food blog, we encourage you to download this free ebook, “16 Ways to Monetize Your Food Blog,” from our sister site, Food Blogger Pro!
Traffic Totals
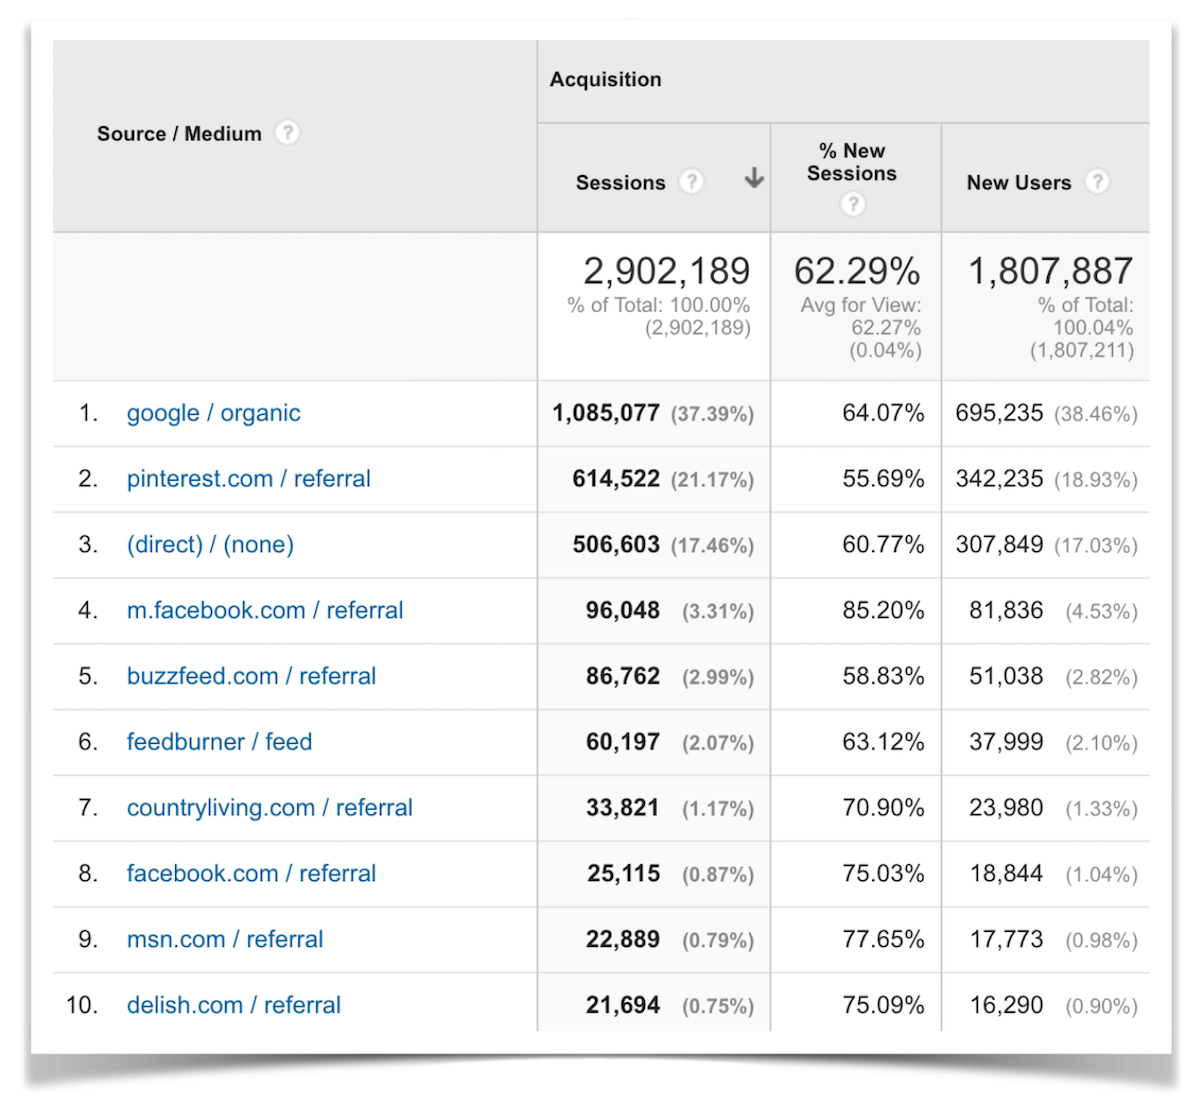
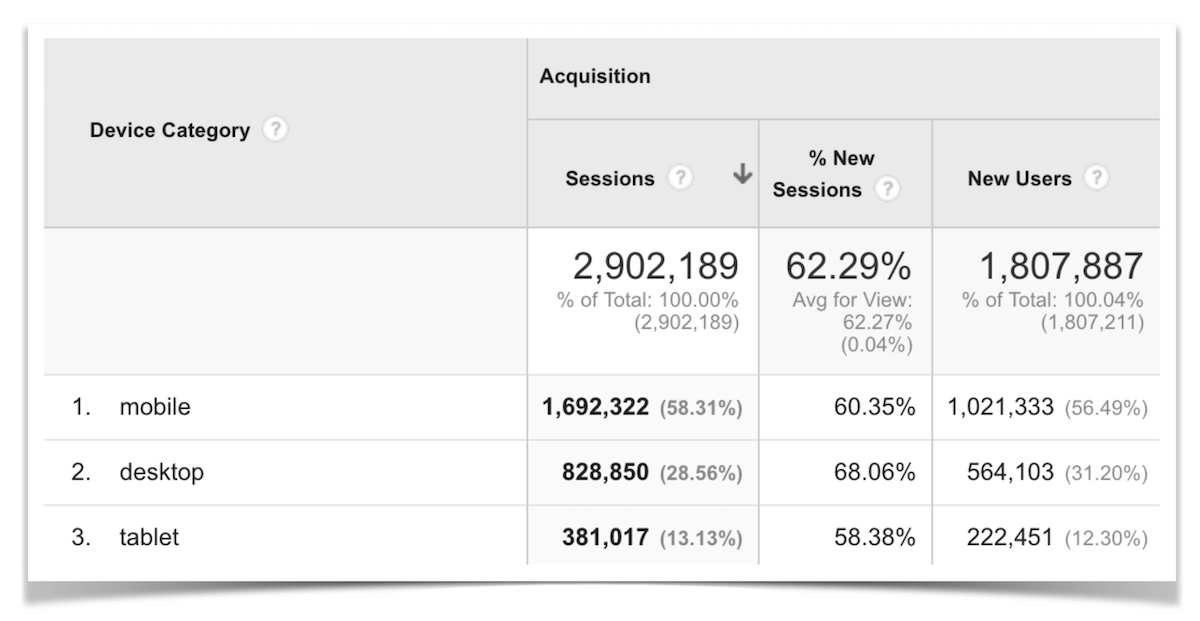
Below are some Google Analytics screenshots from the month of August 2016.
Traffic Overview

Top Ten Traffic Sources
Mobile vs. Desktop vs. Tablet

This month we’re trying something different and we’re going to be focusing on just one takeaway. I’m going to share about A/B testing, why I quit doing it, and why I’m excited about it once again.
A/B Testing
Some of you might remember a few posts I wrote about A/B testing using Google Analytics. Specifically, these two:
- How to Increase Your Conversion Rates with A/B Testing
- How we improved our landing page conversion rate by 138%
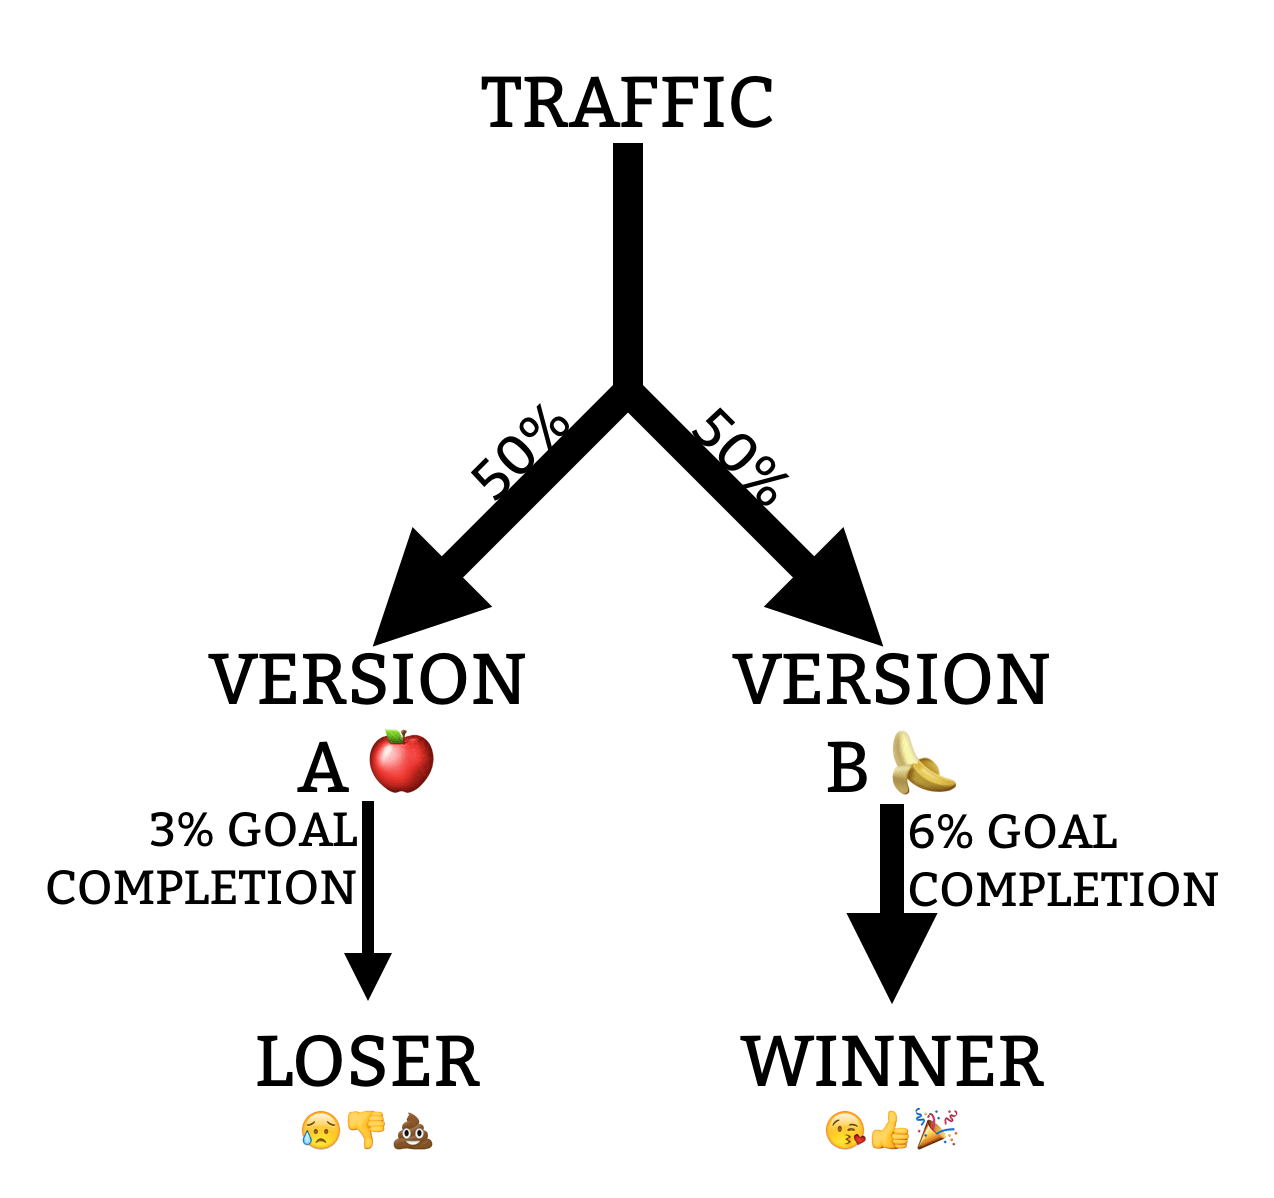
For those that aren’t familiar, A/B testing is the online version of a taste test. In a taste test you’re asking people which version they like better: Version A or Version B.
The same is true with an online A/B test. You want to find out version is best: Version A or Version B. But instead of showing one person both versions, you show 50% of people Version A and the other 50% Version B.
How A/B testing works
Here’s a basic overview of how A/B testing works:
- Create a new version of an important page on your site
- Pick a goal (i.e. sign up for my email list)
- Show the old version to 50% of visitors and the new version to the other 50%
- The version with the most goal conversions wins
A/B testing fits really well with our philosophy of 1%∞.
1%∞ (one percent infinity) is all about making small improvements (one percent) every day over a long period of time (infinity). The symbol for infinity looks like this: ∞. Put it all together and you get 1%∞.
Really small improvements on important pages can have a huge impact on your business.
For instance, we’re currently running an A/B test on the Nutrifox home page. The previous conversion rate for free trial signups was about 3%.
Here’s what Version A (original) and Version B (the new one) look like:
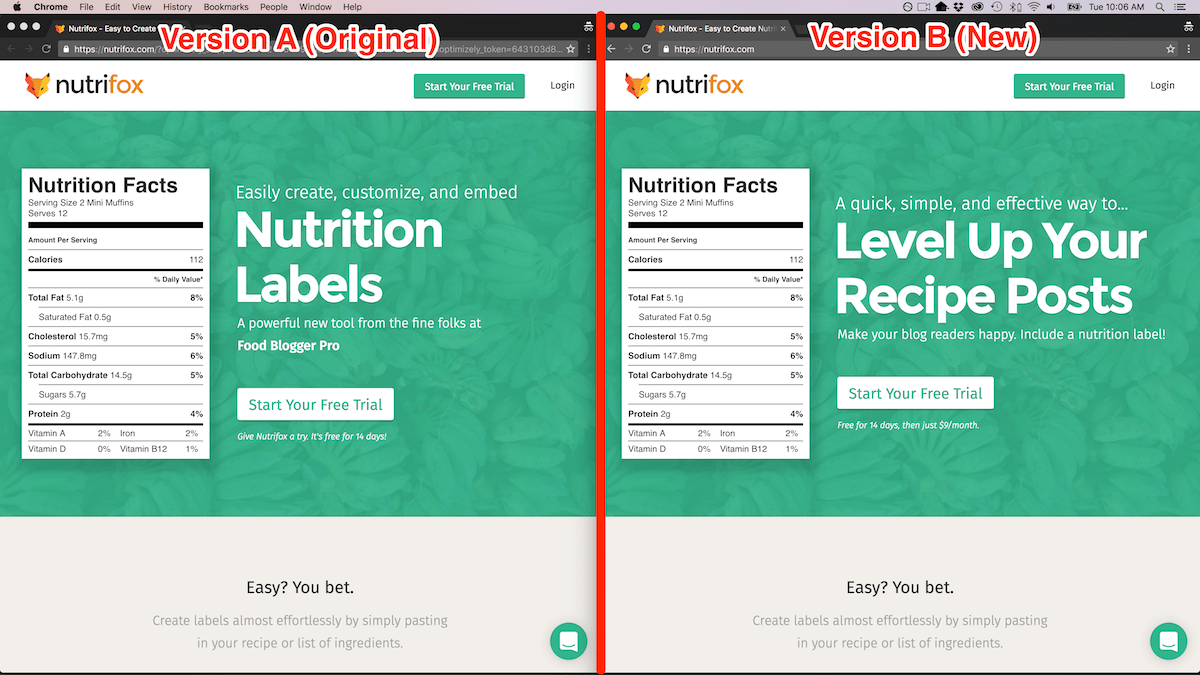
We’re still really early on in the experiment, but the new version that we’re testing is converting at 13%. Even if that goes down to 6% by the time the experiment ends it would still mean that we’d be getting 100% more free trial signups with this new version of the home page. That’s a major improvement.
I had fallen off of the A/B testing bandwagon for a while because of the complexity with the way that we used to do it.
I was previously using Google Analytics to run these experiments, but the bummer with A/B testing in Google Analytics is that you need to create a brand new page, which meant you’d have two different URLs with similar content, like this:
yoursite.com (Version A: original page)
yoursite.com/test-home-page (Version B: new test page)
Not only is it a pain to create and publish the new page, but it’s also a pain to make sure that the test page isn’t indexed by Google and that you redirect it back to the home page after the A/B test is done running.
Those are relatively small things, but the friction was enough to keep me from continually running A/B tests on important pages.
Which is sad, because there would have been some massive improvements that could have been made over the past two years.
So what’s the solution?
The most important thing for me was finding something that removed the friction of running an A/B test.
The solution that I found is a software called Optimizely.
It’s a super simple way to set up an A/B test. The two things I like are (1) it doesn’t require publishing a new page and (2) it doesn’t require any HTML editing.
It comes at a cost ($50 per 1,000 page views), which isn’t cheap. That’s why it’s important that you’re only using this for high-value pages, which brings me to my next point.
Our Action Plan For A/B Testing
Here’s our action plan for A/B testing. My goal is to keep it really simple to start.
- Identify high-value pages and their goals
- Setup (significant) A/B tests for high-value pages
- Let the test run until a winner is found
- If the new design wins then update the high-value page with the new design
- Repeat
1. Identify the high-value pages and their goals
Here are the high-value pages that we’re starting with.
- Nutrifox Home: https://nutrifox.com/
- Nutrifox Free Trial Sign Up: https://nutrifox.com/try
- Food Blogger Pro Home: https://www.foodbloggerpro.com/
- Tasty Food Photography Sales Page: https://pinchofyum.com/tasty-food-photography
And here are the primary goals for each of those pages:
- Nutrifox Home: Sign up for a free trial of Nutrifox
- Nutrifox Free Trial Sign Up: Sign up for a free trial of Nutrifox
- Food Blogger Pro Home: Sign up for the waiting list
- Tasty Food Photography Sales Page: Purchase Tasty Food Photography
Each one of those pages should have a goal.
The easiest type of goal to track is a URL goal. For instance, after someone signs up for something they usually see a confirmation page like yoursite.com/thanks-for-signing-up.
You can use that URL as your goal, as the only people that land on that page should be people that have successfully signed up. This is how we determine the success of those pages.
2. Setup (significant) A/B tests for those pages
Significant is an important word with this step. The general idea is that you don’t want to test tiny things like changing a button color or a single word.
You want to make significant changes, like switching out headlines, changing the structure and layout, or trying new colors. These changes are relatively easy to make within Optimizely.
3. Let the test run until a winner is found
This is the easy part. You just let the test run.
One thing to note is that with every test you’ll be able to pick a significance level.
The significance level is essentially saying “we’re this confident that the results of this test are due to the changes you made and not due to chance.”
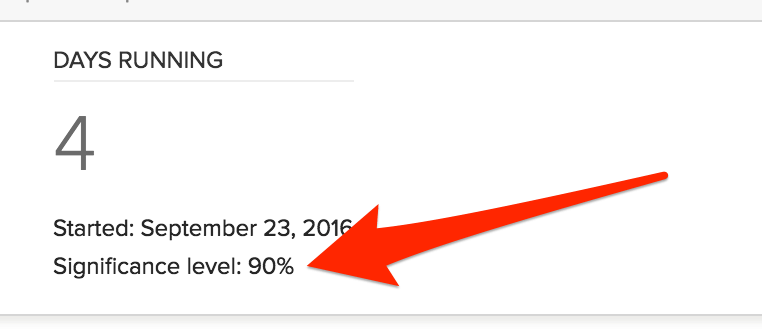
For the tests we’re running we’re using a 90% significance level.
4. If the new design wins, then update the page with the new design
If the winning version is the new design then update the page to that new version.
Congrats! You’ve just increased your conversion rate.
5. Repeat
Rinse and repeat. Your new goal is always to beat the previous winner.
Conclusion
If you have high-value pages, it’s time to start running A/B tests on them. The improvements you’ll see with the performance for those pages will almost always be worth the time that you spend setting up and running the tests.
Because Of You
It’s because of you that this thing we call Pinch of Yum can exist as it does today. Thank you so much for making these recipes, leaving comments with your love and feedback, sending emails, following on social media, and sharing this food around the table with your families and friends.
Every month we use a portion of the income from the blog to support a special project at an orphanage that we worked at for a year called The Children’s Shelter of Cebu. We view it as a donation from the POY community, not just Lindsay and me since you all are a vital part of keeping this little corner of the internet going strong.
This month we’re supporting CSC by donating to their meal fund. Every child at CSC gets three solid meals a day. All 90+ of them! That’s a lot of hungry mouths to feed and we’re honored to be able to help put food on the table for these kids.
The post August Traffic and Income Report appeared first on Pinch of Yum.
