
Hiya!
Bjork here checking in for our monthly traffic and income report. Once a month we press pause on the food content and pull back the curtain on the inner workings of Pinch of Yum, taking a look at the previous month’s traffic and income. We’ve been doing these reports since August of 2011 – way back in that first month, we earned a total of $21.97.
Pinch of Yum as a blog has been around since April of 2010. That’s almost five years old, which is like 40 in blogging years.
I’d like to think we’re experts, but the reality is that the internet is kind of like my parent’s dog Sophie – it’s moving at 100 miles an hour, which means you can never catch up with it.
Things that work today won’t necessarily work tomorrow. Myspace is cool, then it’s not. Twitter is weird, then it’s normal. Your post shows up on the first page of Google, then it shows up on page three.
It’s exhausting. And interesting. And awesome. And it means that we’ll always have something to talk about in these posts.
So why did we start doing these reports in the first place?
I used to have a 30-45 minute commute to work. On the way I’d listen to podcasts and audiobooks, or as I like to call them, “books on tape.” I’m a non-fiction fanatic and especially interested in online business, so I’d listen to podcasts like Smart Passive Income (which we were just interviewed on, thanks, Pat!), and audiobooks like Crush It! by Gary Vaynerchuk.
The common thread with all of these resources was the idea that you can “do this” if you hustle, stick with it, and have the courage to put yourself out there every day (after day after day after day).
So Lindsay and I started these monthly reports as an experiment, testing out that common thread of advice. Four years later, we’re still here, coming back every month and continuing on with this experiment in figuring out what works (and what doesn’t) when it comes to building a business online.
Last month, I asked Lindsay to start contributing to these reports as well, because, to be honest, she does most of the work with this blog. I help with the some of the behind-the-scenes stuff like ads and server maintenance, but 98% of the growth of Pinch of Yum isn’t a result of some internet marketing strategy I thought of – it’s the result of Lindsay writing 650 posts over five years, each one containing a recipe that she’s tested (oftentimes multiple times), food photos that she’s carefully arranged and meticulously edited, and content that’s she’s crafted in a personal and engaging way.
We (definitely) don’t have all the answers and we’ve learned a lot from you, our community, in the process. We’re honored to be doing this and hope that these reports help to show you that you too can “do this” if you hustle, stick with it, and have the courage to put yourself out there day (after day after day).
Let’s take a look at the numbers for January.

A quick note: Some of the links in this post are affiliate links. All of the products listed below are products and services we’ve used before. If you have any questions about any of the income or expenses you can leave a comment and I’ll do my best to reply.
Income Totals
- Bluehost – $7,475.00 –> this income comes from a page where we show people how to start a food blog in three easy steps.
- sovrn – $4,450.74
- Tasty Food Photography – $3,943.50
- Yellow Hammer Media – $2,762.78
- BlogHer – $1,639.22
- Genesis Theme – $952.12
- Google AdSense – $822.68
- Sponsored Posts/Speaking – $700.00
- The Blogger Network – $605.85
- Everyday Healthy eCookbook – $541.00
- Ziplist – $461.80
- Amazon Associates – $446.93
- The Creamy Cauliflower Sauce eCookbook – $441.00
- Elegant Themes – $167.00
- How to Monetize Your Food Blog eBook – $105.00
- Gourmet Ads – $94.40
- Thesis Theme – $65.01
- AWeber – $26.10
- LeadPages – $22.20
Total Income: $26,310.31
Expense Totals
- Travel – $2,103.00
- eBook Affiliates – $1,080.63
- Support Staff – $587.98
- Media Temple (Hosting) – $519.00
- Web Development – $480.00
- Food Expenses – $435.00
- Amazon S3 and Cloudfront – $355.70
- PayPal Transaction Fees – $298.94
- MailChimp – $150.00
- Bookkeeping – $150.00
- Shipping and Office Expenses – $90.47
- Food Photography Equipment – $85.90
- Coworking Space – $70.00
- WP Curve – $69.00
- LeadPages – $67.00
- Adobe Creative Cloud – $53.55
- PayPal Website Payments Pro – $30.00
- Shoeboxed – $29.95
- ViralTag – $28.00
- QuickBooks – $26.95
- VaultPress – $20.00
- Time Doctor – $19.98
- E-Junkie – $18.00
- Boomerang – $15.00
- Pin it Button – $14.50
- Backupify – $12.00
Total Expenses: $6,810.55
Net Profit: $19,499.76
If you’re interested in learning more about some of the ways that you can monetize a food blog, we encourage you to download this free ebook, “16 Ways to Monetize Your Food Blog,” from our sister site, Food Blogger Pro!
Rpm
RPM stands for revenue per mille. Mille is Latin for thousand, so you could also say that RPM is a number that shows you how much revenue your website earns for every 1,000 page views. It’s a helpful metric because it allows you to see how effective you are at monetizing your blog.
Below is the RPM that we had for Pinch of Yum in the month of January.

Traffic Totals
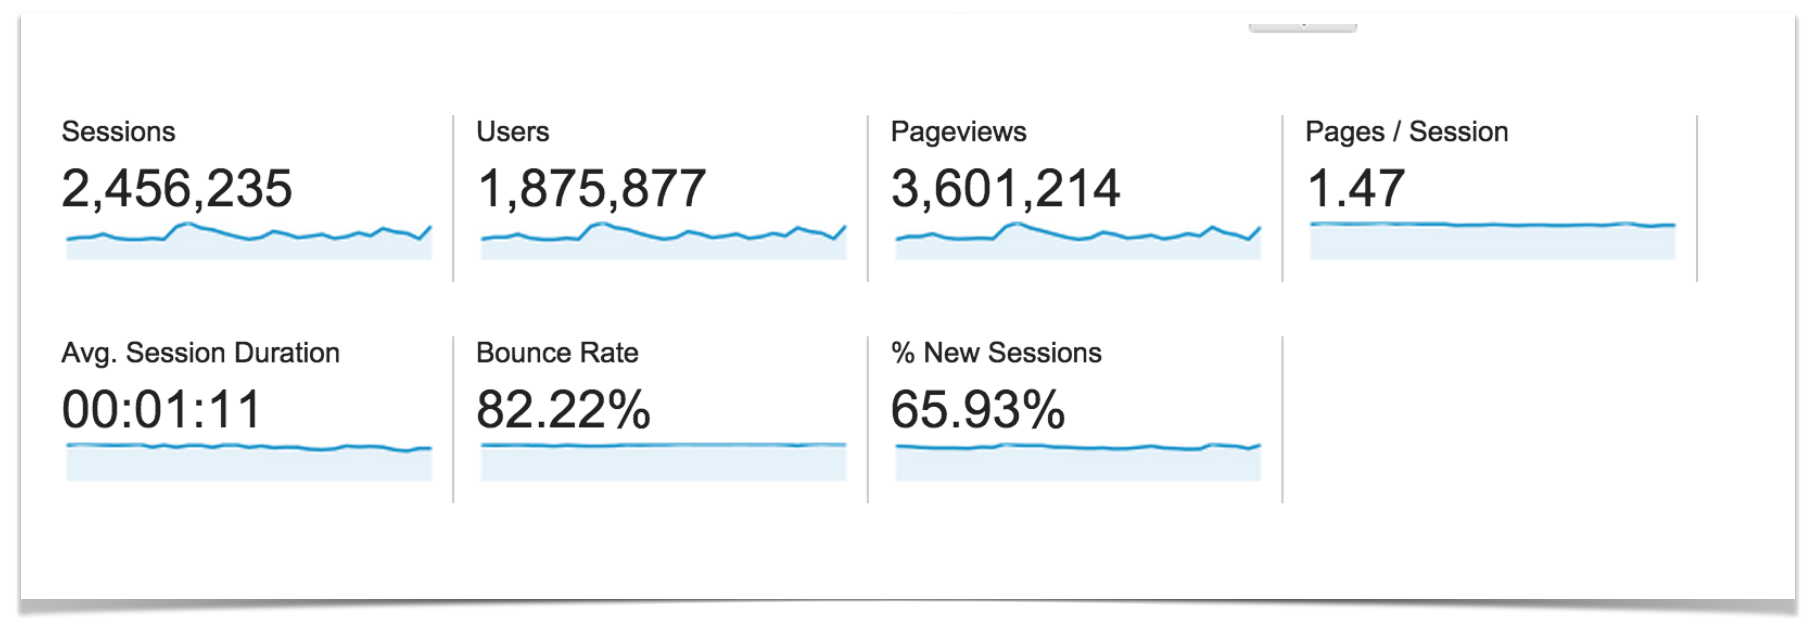
Below are some screenshots from Google Analytics. You can click on these images to view a larger size.
Traffic Overview
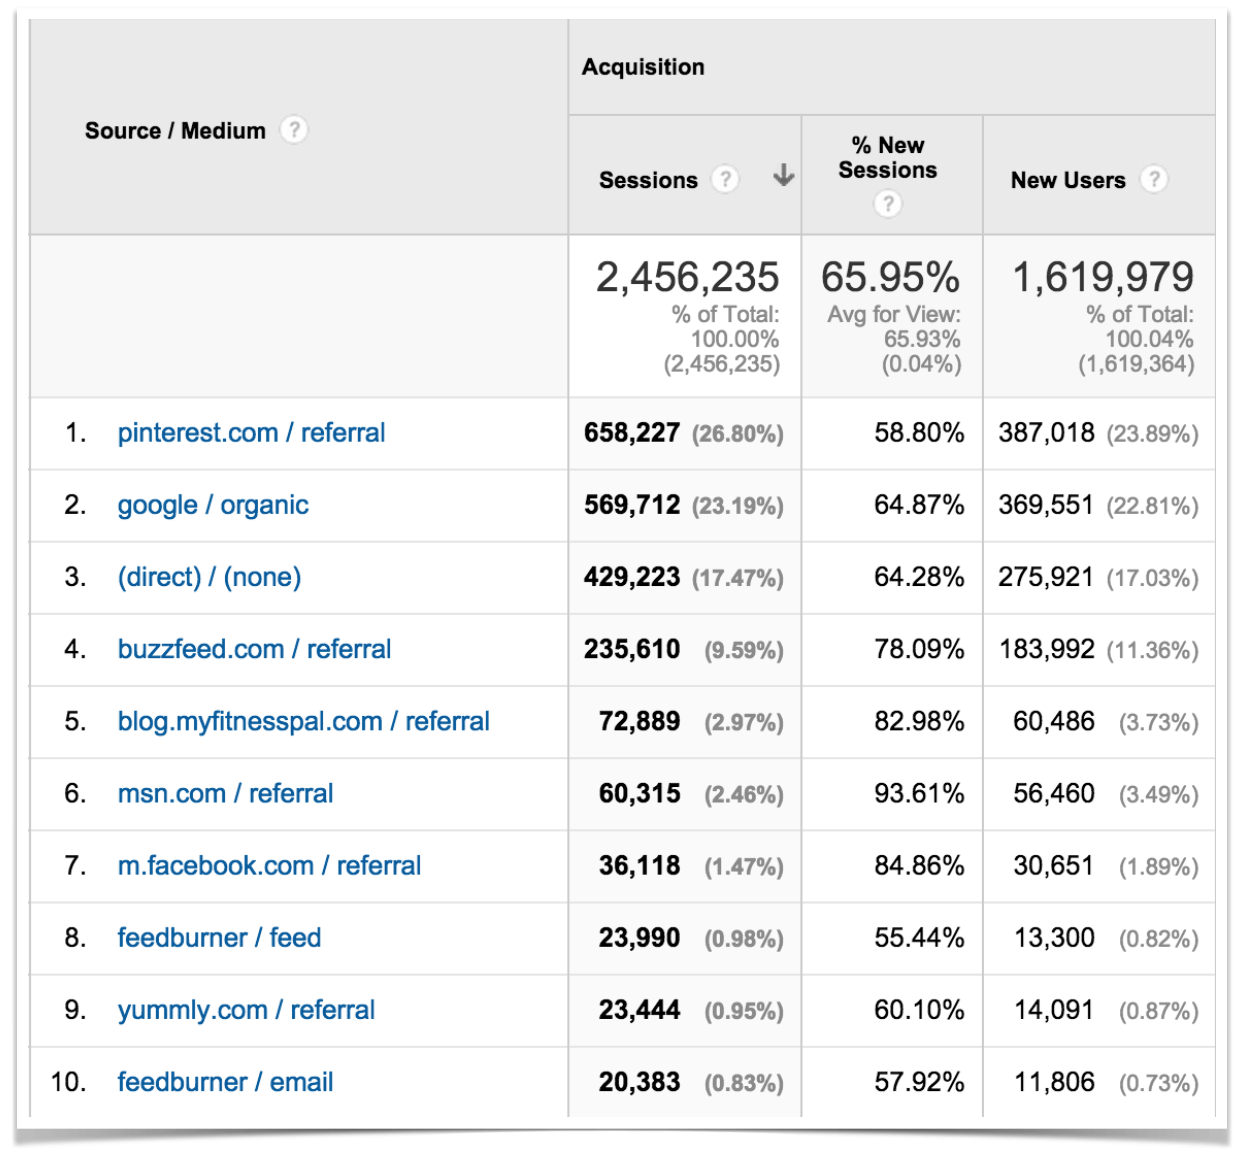
Top Ten Traffic Sources
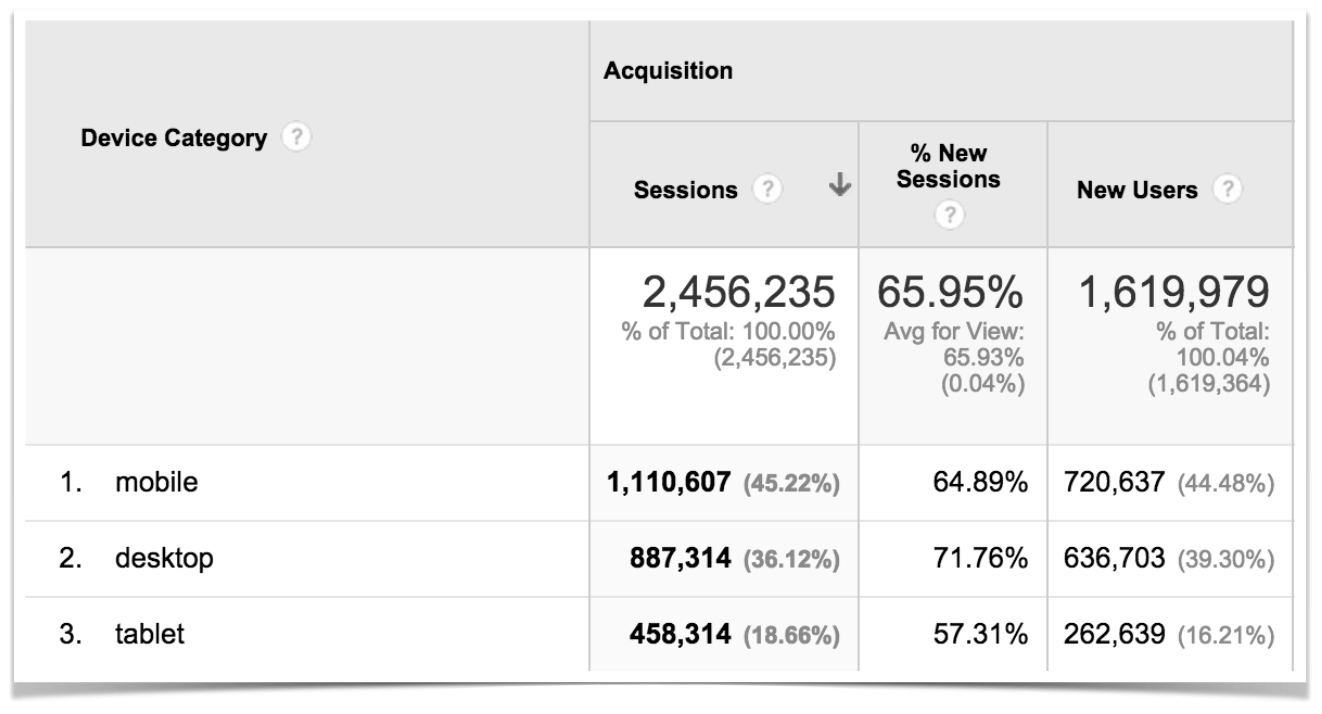
Mobile Vs. Desktop Traffic

Long Pinterest Images

It might sound weird, but we (Bjork/Lindsay/Pinch of Yum) are so thankful for Pinterest. Like, really thankful. Food blogs are lucky because the most popular genre on Pinterest is food and recipes. Whoa! Huge implications there.
And Pinch of Yum specifically is lucky because even without our presence on an official Pinterest page for the first three and a half years of the blog, we have awesome readers who have always been excited to pin their favorite Pinch of Yum recipes, which has made Pinterest one of our most significant sources of traffic.
But I’ve had this idea floating around in my head for a while now. Being that we have more than 650 recipe posts, I’ve been thinking about moving away from a Pinterest strategy of simply creating MORE content, MORE recipes, MORE posts in order to get more exposure on Pinterest – and instead moving towards a strategy where the focus is on maxing out the pin potential of the content that we already have on Pinch of Yum.
Enter: our current Pinterest project, which is bringing new life to older posts that we already know are popular amongst food and recipe lovers on Pinterest.
The goal of the project is simply to re-package the most popular older posts into new “pins” (newly designed images, really) in order to continue getting those posts in front of people.
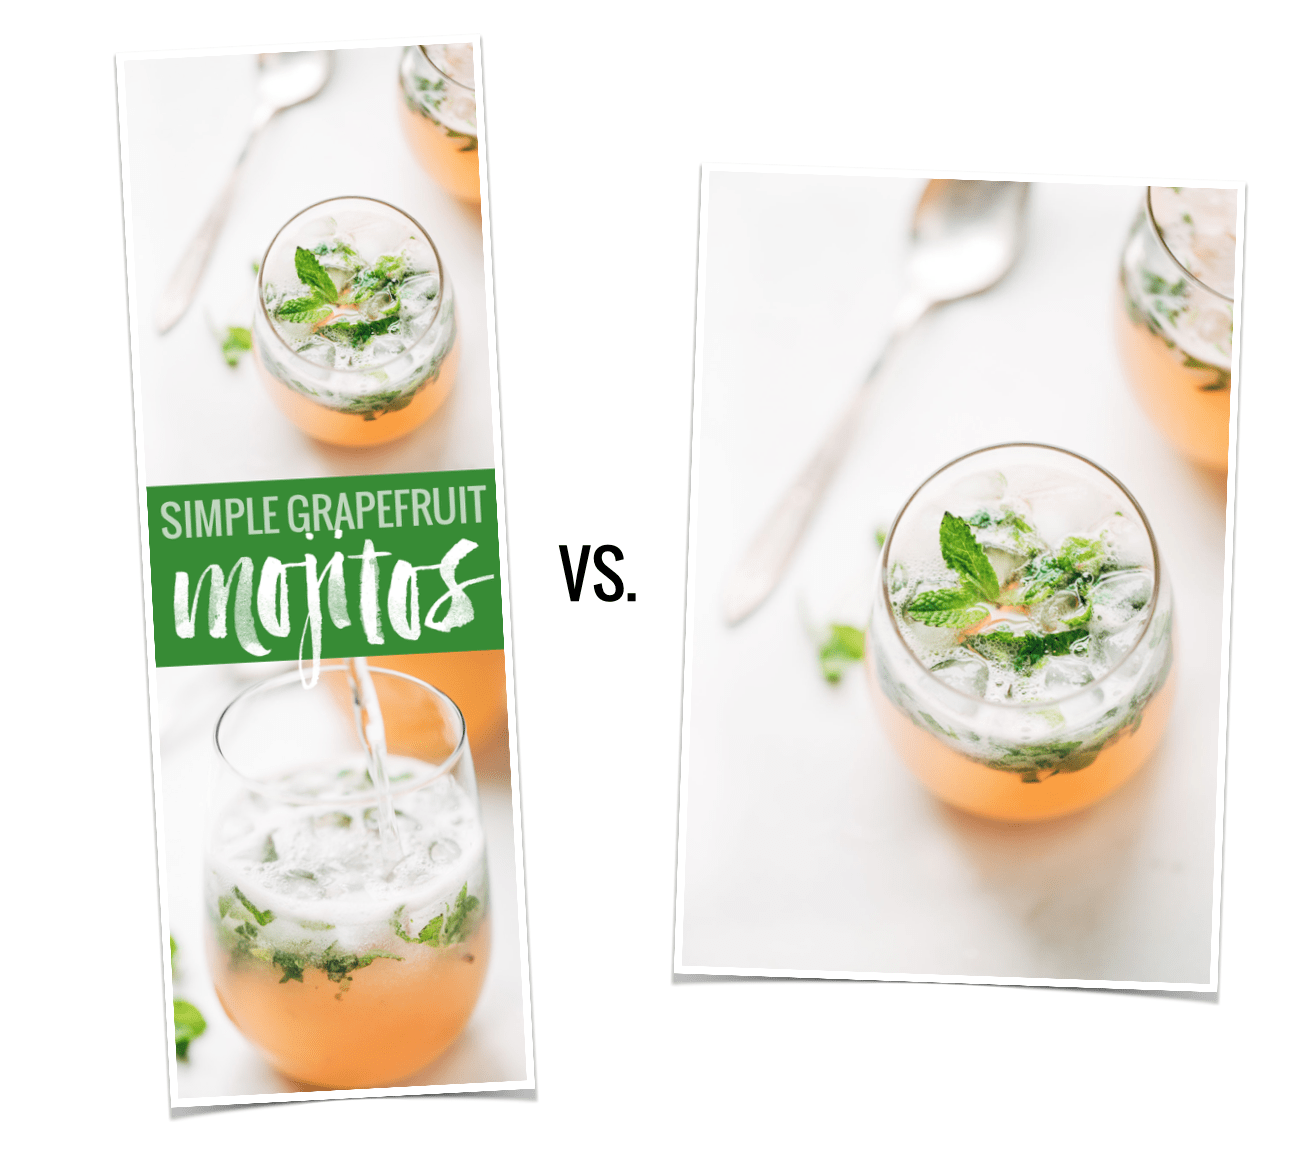
I keep hearing time and time again that these long, text-filled pins do, in fact, perform better on Pinterest, but I haven’t read any official data that confirms that in a concrete way. (That being said, please leave a comment if you have something! I’d love to see some numbers behind this concept.)
In order to create the type of pins that really connect with people, we need to ask the question: what format is the most engaging format for sharing recipes on Pinterest? Is it these long pins with multiple images collaged together? Images with text on them? Regular images? All the while, we need to keep in mind that the answer to this question might be different from what is most engaging to US on Pinterest. This isn’t a question of personal preference as much as it’s a question of what is engaging for a large group of people casually browsing for recipes.
So here’s the project overview:
- Identify the top 100 recipes from the last two years using Google Analytics.
- Create long images with text for the top 100 recipes using a standard style (similar layout, fonts, and colors) in Photoshop.
- Schedule each of the top 100 recipes to pin with both the long image and with a regular-sized image.
- Track performance on the two pins using Tailwind to see which is more engaging for our followers.
Our intern Abby is managing this project, which is a dream come true. Shout out to you, Miss Abby! You rock.
This is all pretty new, like within the last few weeks, so we don’t have any comprehensive data to share just yet, but when I took a quick glance at the analytics, the results seemed to be similar whether the image was “regular” or a long, collage-style image with text.
My hope is that after consistently doing this and comparing the two types side-by-side, we’ll walk away with clear information that either says yes! this long image format an effective format for engaging our audience, or no, this is not necessarily a better way to make recipes engaging on Pinterest. We will report back once we’ve let this little system gather data for a while.
As a side note, there are two angles to look at when it comes to analyzing pin performance:
- Pin activity generated from the Pinch of Yum Pinterest page
- Pin activity generated directly from pinchofyum.com
And the focus for this project is the pin activity on our Pinterest page.
What’s your experience been with using longer pins on Pinterest? I would love to hear from you guys on this one!
Traffic Spike In January

We humans are interesting. I love us. I love studying our habits and figuring out what makes us tick. I love trying to understand how our minds work and why we make decisions.
That’s one of the reasons why web analytics is so interesting to me.
Analytics allows you to spot trends and habits that you otherwise might not be aware of.
For instance, one of the food trends we’ve noticed over the past few years is that January is a really popular month for food-related content. We’ve also heard from some Food Blogger Pro members on the community forum that have said they’ve noticed similar trends.
It makes sense. People are settings goals and making new resolutions to lose weight, eat healthier, and make more home-cooked meals.
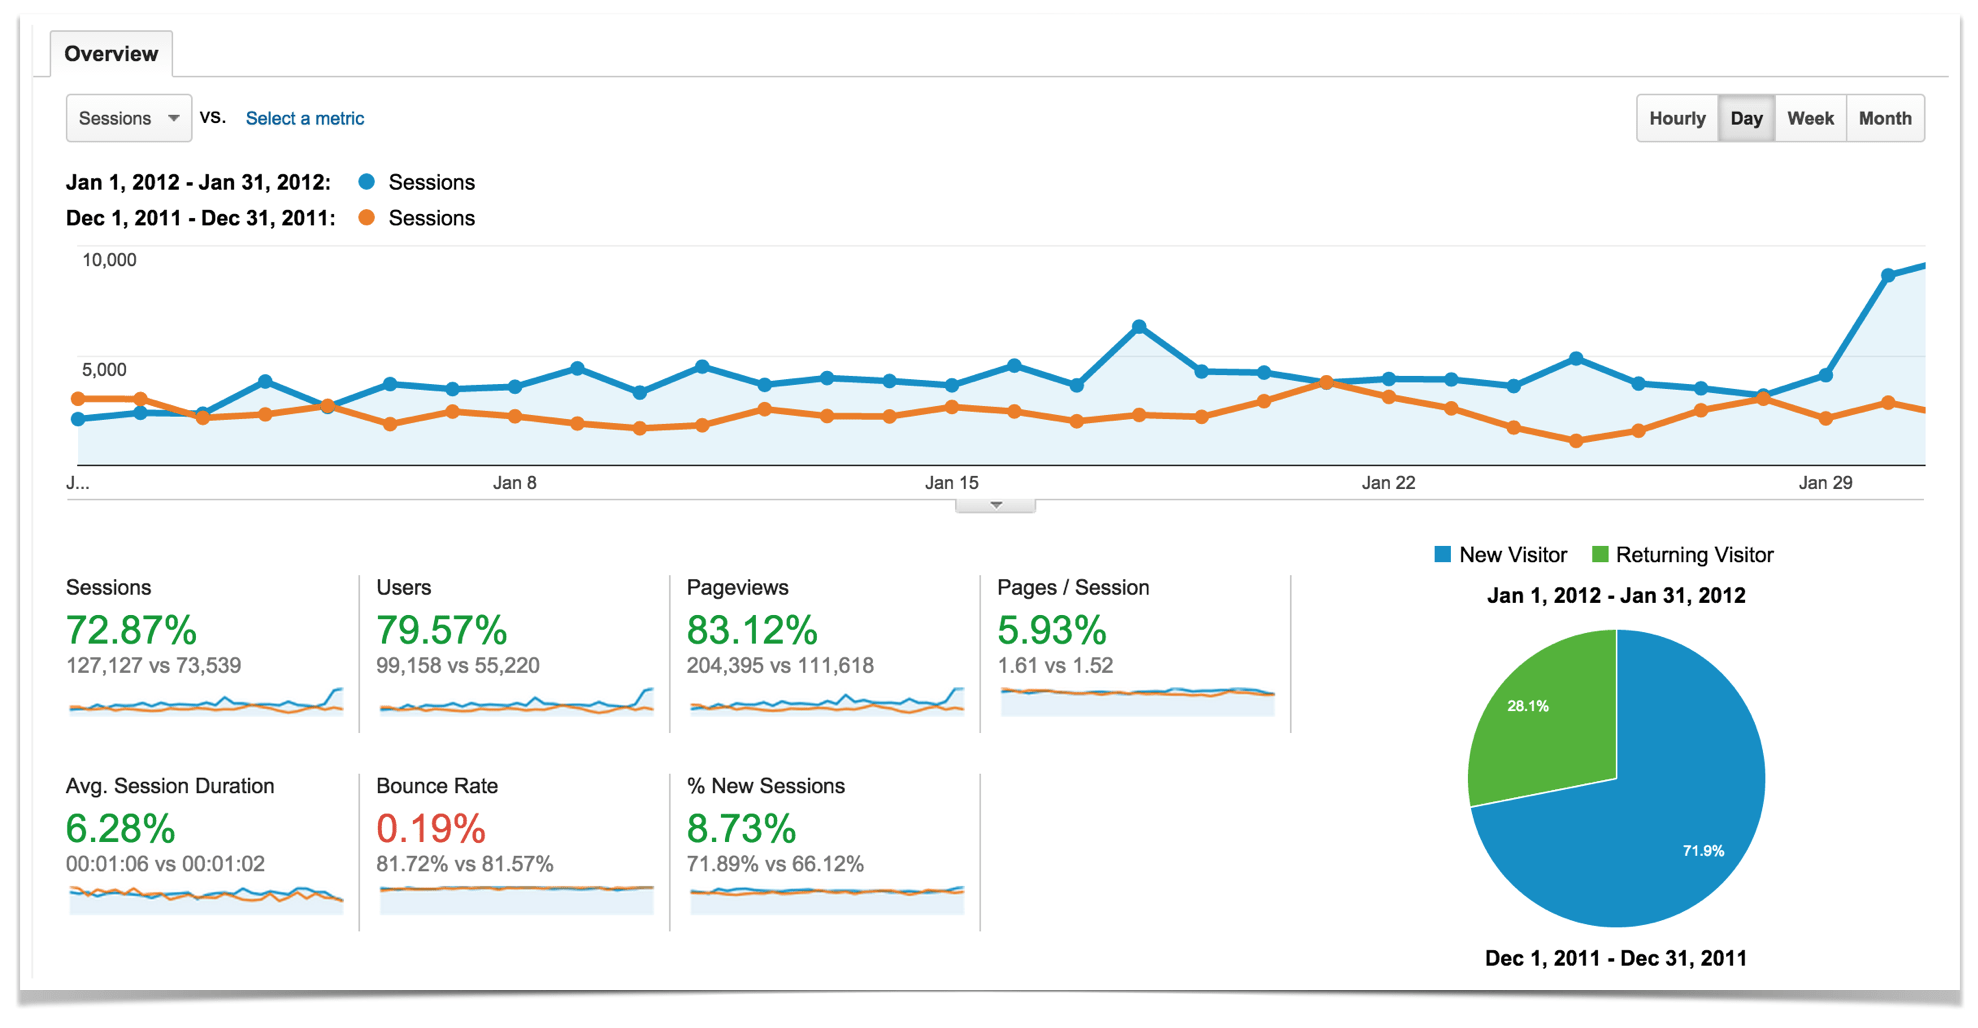
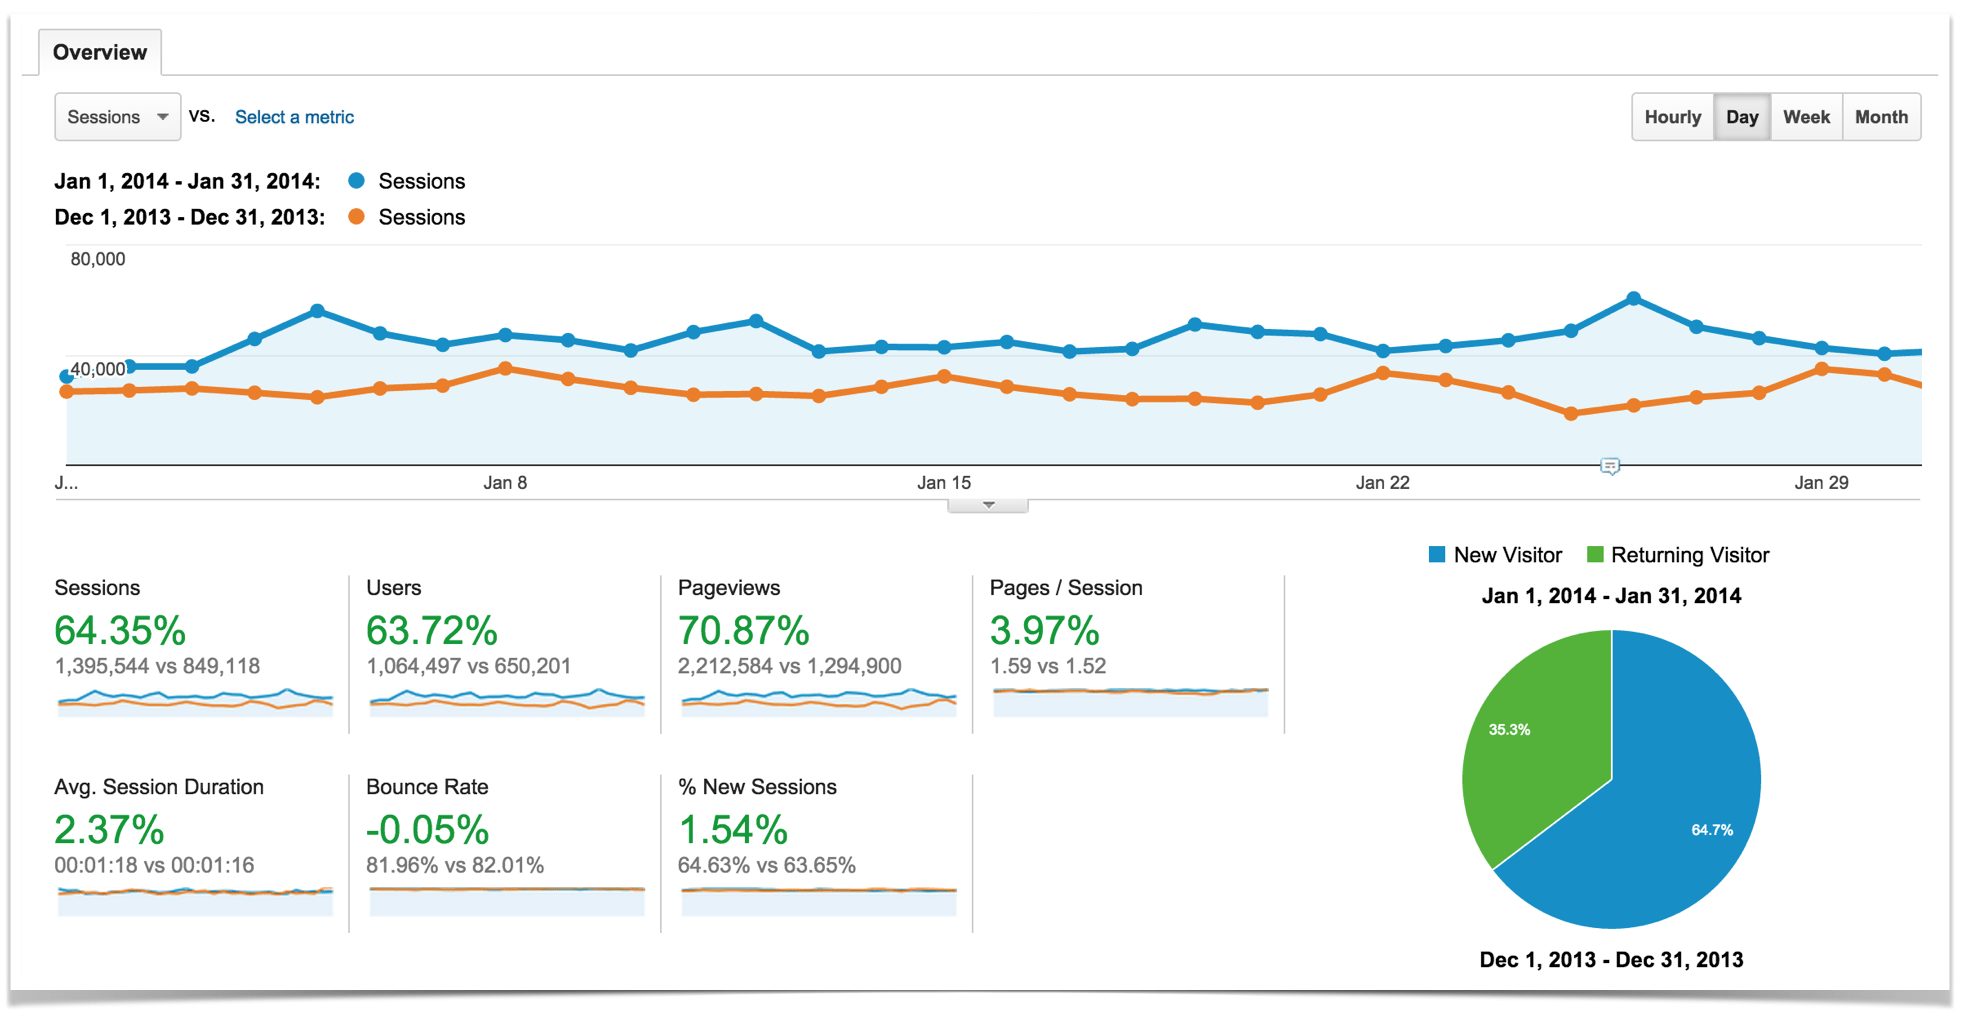
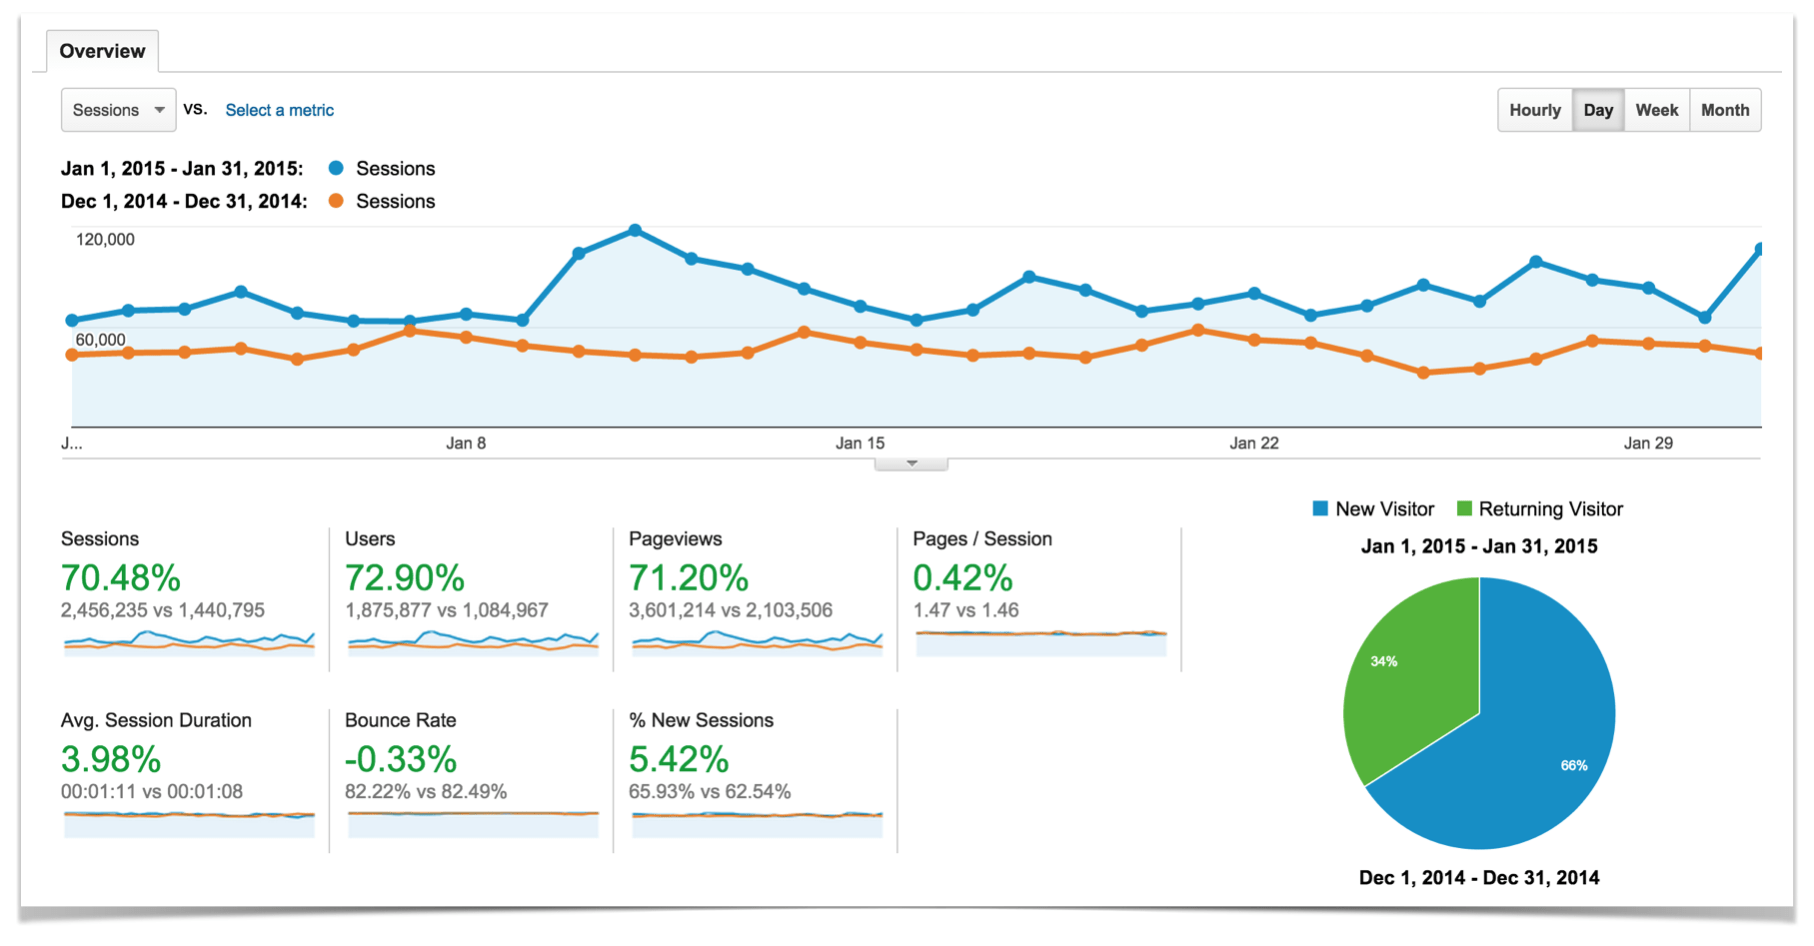
The December to January jump in traffic has consistently been one of the biggest jumps we see. Check it out for yourself. These are the December to January comparisons from the past four years:
January 2012 compared to December 2011
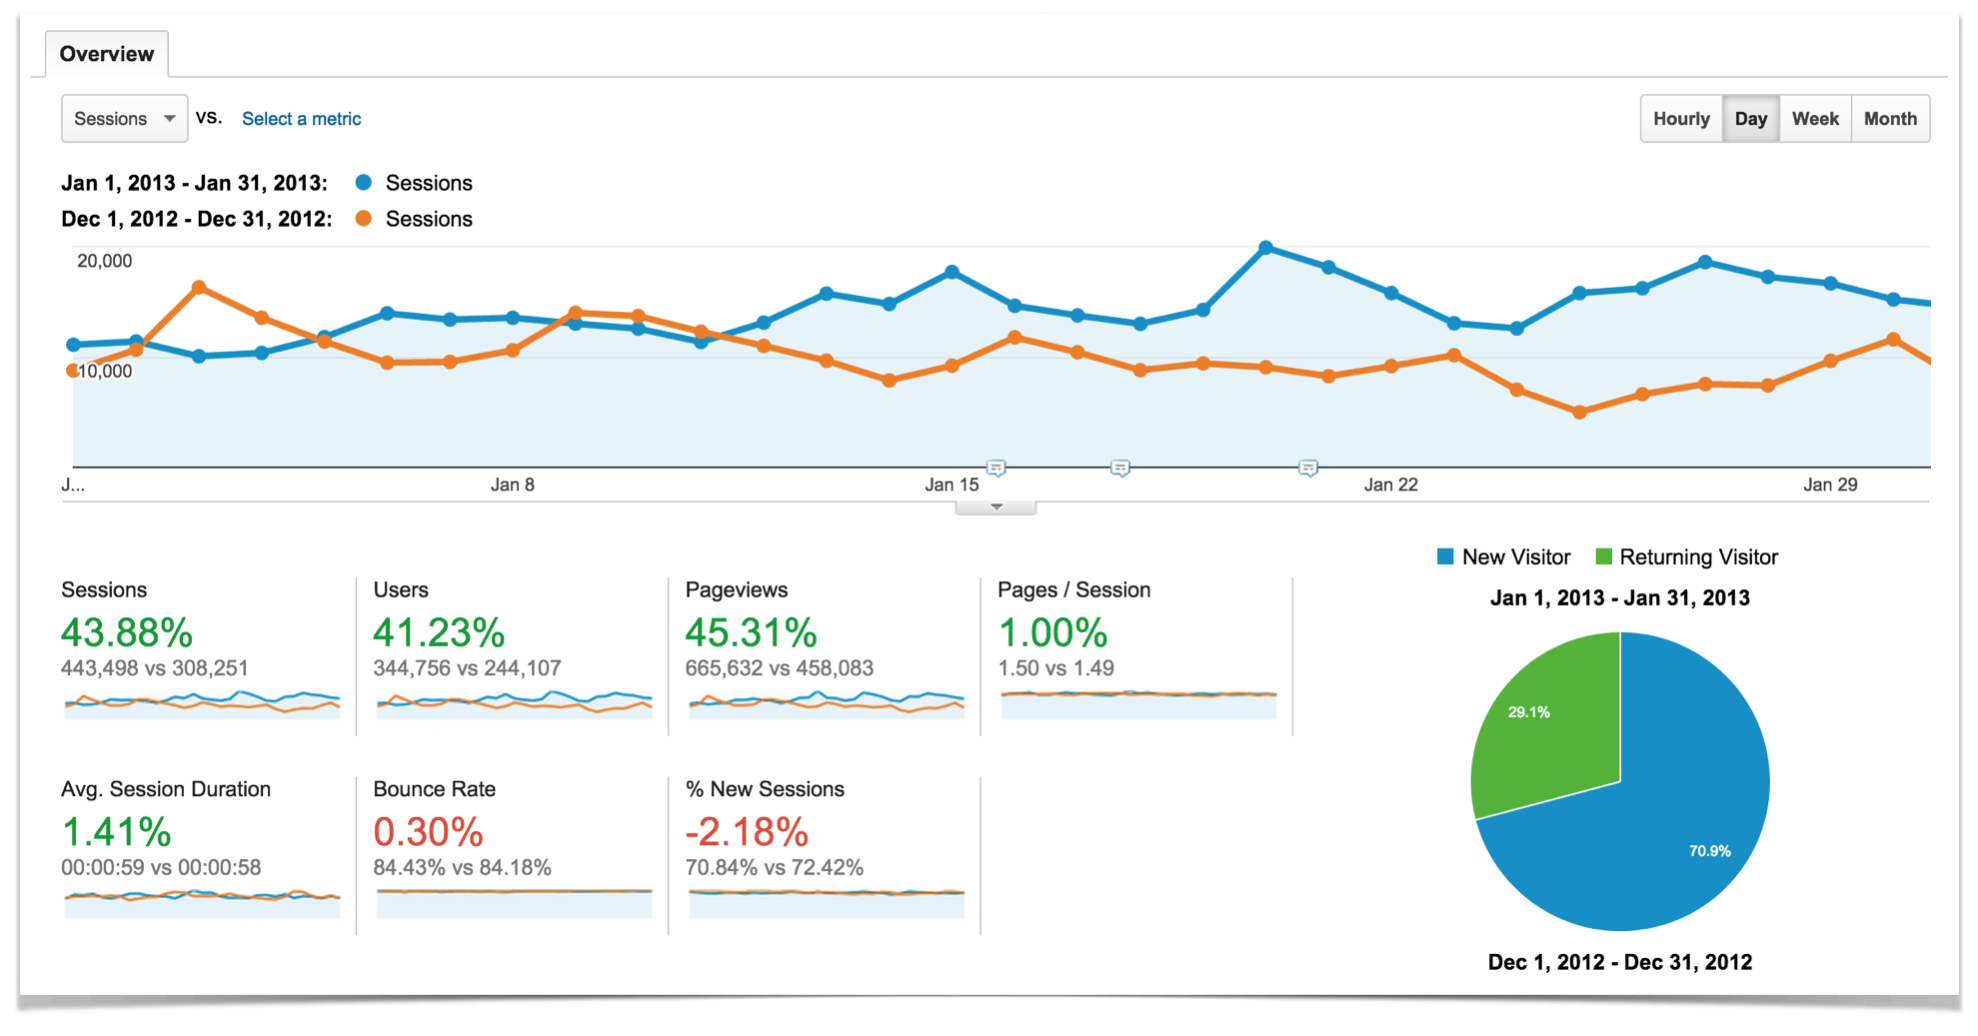
January 2013 compared to December 2012
January 2014 compared to December 2013
January 2015 compared to December 2014
Pretty cool, right? But why does it matter?
It matters because the more we understand the mindset of our readers, the more value we can offer. Here’s how Rand Fishkin, co-founder of Moz, communicates the same idea around building your blog’s SEO:
“One of the most important elements to building an online marketing strategy around SEO is empathy for your audience. Once you grasp what your target market is looking for, you can more effectively reach and keep those users.”
Rand Fishkin
I love that phrase: empathy for your audience.
In other words, what are people looking for when they come to your blog? Don’t forget that this often changes depending on the time of the year.
For instance, when looking at five years’ worth of analytics, I feel confident in predicting that come January 2016, Pinch of Yum will see a spike of traffic, and that it will largely be due to the fact that people will be looking for recipes related to their new year’s goals and resolutions.
If we’re hoping to “more effectively reach and keep those users,” then we would need to have empathy for them and create content that helps meet their needs.
Content like a free “Top 20 Healthy Pinch of Yum Recipes” eBook offered to anyone that signs up to the email list or a healthy recipe round-up (with a link to it in the sidebar or main navigation) would be an example.
It’s easy for us as bloggers or website owners to look at our analytics, see a spike in traffic, and do a happy dance. Is increased traffic a cause for celebration? Absolutely. But let’s not forget that each one of those data points represents a person, and oftentimes those people might be trying to solve a deep and pressing issue. Maybe it’s cooking more real food for their family, maybe it’s losing weight, maybe it’s cooking meals for someone in need, maybe it’s learning how to cook for the first time.
Bloggers that can understand the needs of their readers, as well as when those needs will arise, are setting themselves up to be really successful.
Price Change For Tasty Food Photography
We’ve talked about it for a while now, but we finally did it! This month we officially updated the price of Tasty Food Photography from $19 to $29.
Tasty Food Photography is an ebook I wrote and self-published three years ago that, much to my surprise and delight, has grown into one of the top ways for monetizing Pinch of Yum.
So why the change in price?
The ebook started out as a PDF that was roughly 40 pages long, and it included access to more than 15 tutorial videos explaining how to use the editing tools in Lightroom and Photoshop.

Over the last three years, we’ve done two comprehensive updates to both the book itself and the editing tutorial videos – one update in 2013, and another update just this month. At this time, the book is now more than 60 pages long and the editing tutorial videos are completely up to date with the most recent version of Lightroom and Photoshop.
With these updates comes an increased value for the product.
Another reason for the price increase is that the book has now proven itself – in the beginning, there was no “proof” that this was a helpful or effective product. But at this point, almost 6,000 people have used Tasty Food Photography to improve their food photos, and that social proof in and of itself makes the product more valuable.
Tasty Food Photography is now an established, proven way for people to discover how to improve their food photography.
There are two things we’ve learned from this:
- Create valuable products. Make them easy to read and understand, update the information when needed, and prioritize the overall customer experience above anything else. Value is first and foremost when it comes to products for your audience.
- Value can change over time, and you’re not always right the first time when it comes to pricing a product. We decided on the $19 price point for Tasty Food Photography after a 15-minute conversation one week before the book was launched. While you shouldn’t continually change your products’ pricing, it’s worth revisiting it every once in a while to assess the value of the product and whether the current price point is still the best price point.
As a quick note, if you’re an affiliate, your banner ads will be updated to reflect the new price automatically.
The only exception is for affiliates who uploaded the ad image directly to their site rather than using the affiliate code. If that’s you, just grab one of the updated banner ad images on this page.

A Note A Day
This month I took on a challenge to write a note a day. This idea was inspired by my friend and fellow food blogger Ali from Gimme Some Oven. She wrote a post encouraging everyone to take time every day to send a note – either a handwritten note, or a text message, or a phone call – to tell our friends and family and our people in the world how and why we love and appreciate them.

I have so many people I love! I have the most adorable pink pen! I have these delicious-looking chocolate chip cookie note cards! Sold.
I had my list of Note People made within about three minutes on February 1st. Then came the actual writing part of the rest of the month, and I realized: I love my people, but I am painfully slow and awkward at writing thoughtful cards and texts. What?! Dang. Even though I’m not nearly keeping up with the one-a-day goal that I had initially set, I am slowly but surely working away to get some kind of love note or encouraging text sent to all my Note People before the end of the month.
The practice of sitting down, thinking about my favorite people, and then intentionally telling them what I appreciate about them has been more challenging than I thought — it forces me to get just a tiny bit intimate and vulnerable, which feels good.
So this month, beyond the blog, I’m trying to get out of my comfort zone of food/cat face emojis to actually say the meaningful things that I need and want to say to my people.
Family and Friends
Lindsay and I have one co-worker: each other. And we usually don’t see each other until the end of the day (I usually work from an office).
All of this alone time has made us realize how much we appreciate (and need) quality time with family and friends. It’s one of the most important factors in our overall well-being. This research report called Very Happy People says it well:
“Compared with the less happy groups, the happiest respondents did not exercise significantly more, participate in religious activities significantly more, or experience more objectively defined good events. No variable was sufficient for happiness, but good social relations were necessary.”
Very Happy People
Building these little businesses has been an awesome honor and we love it. We work hard and occasionally put in some long hours, but we’re also realizing that our deepest joy will never come from the success that we find in growing a blog, but in genuine relationships with those we love most.
Now would be a good time for that heart emoji.
️ ️ ️
Because Of You
It’s because of you that this thing we call Pinch of Yum can exist as it does today. Thank you so much for making these recipes, leaving comments with your love and feedback, and sharing this food around the table with your families and friends.
Every month we use a portion of the income from the blog to support a special project at The Children’s Shelter of Cebu. This month we’re supporting CSC by donating to their field trip fund. FIELD TRIP! Awyeah. Every few years, the staff at CSC try to organize a more memorable field trip – in this case, it’s a day trip to take the kids to the neighboring island of Bohol.
We spent some time in Bohol when we lived in Cebu and it was ONE THE MOST INCREDIBLE PLACES EVER. The tiny monkeys, the rice fields, the children playing alongside the road in the quietest, sleepy little villages, The Chocolate Hills, – and, of course, the beaches. We LOVED Bohol.

We are honored to be a part of making sure these children have the chance to see and experience the beauty of the Philippines through one-of-a-kind field trips with their teachers and peers.
If your eyeballs have read all or some or most of the words in this post… you win! Seriously, though, thank you for reading, thank you for loving CSC, and thank you for being our internet friends!
The post January Traffic and Income Report – $19,499.76 appeared first on Pinch of Yum.