Greetings! Bjork here, checking in for Pinch of Yum’s monthly traffic and income report.
For those of you that are new ’round these parts I’ll provide a quick explanation of what these posts are all about.
Back in the summer of 2011 Lindsay and I were chatting about her food blog (the one you’re reading!) and what the future held for it. She had started Pinch of Yum as a hobby but was diligent about consistently posting new recipes and improving her food photography.
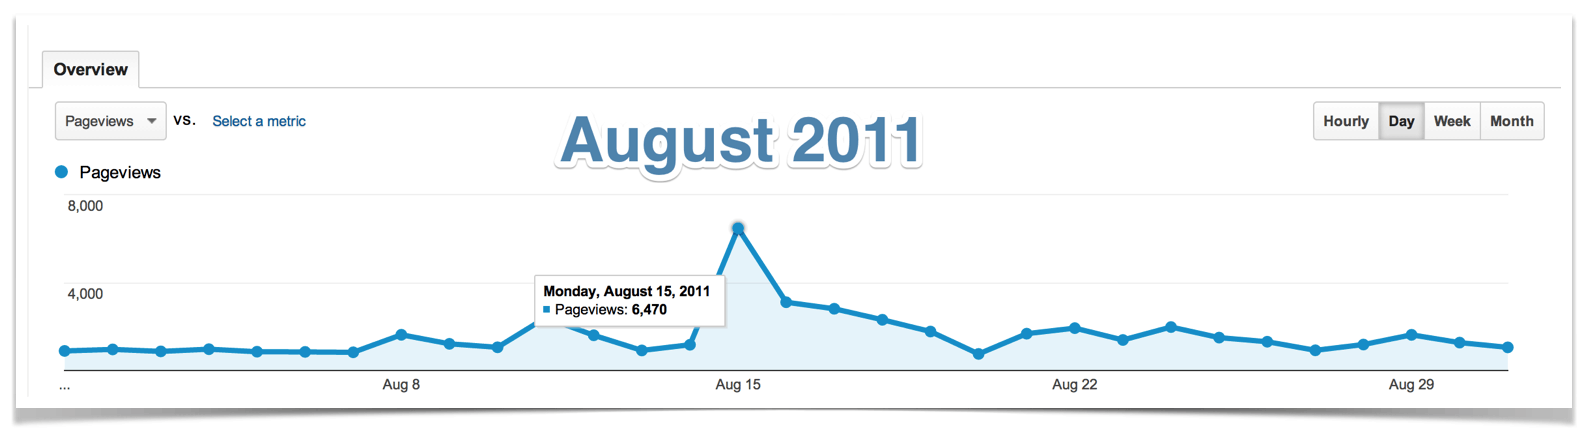
The blog was growing (slowly but surely) and had just hit an exciting milestone: 6,000 page views in one day (before that the average was around 800).
I had been involved with the blog from a distance but started to take more interest as I learned more about internet-based businesses.
At the time I had just finished listening to a book called Crush It by a social media and wine expert (a strange combination, I know…) named Gary Vaynerchuk. In the book Gary talks about building a personal brand and creating an income from your passion, using the internet as your platform. This was information source #1.
I had also just recently read an article by a food blogger that talked about monetizing a blog. The basic gist of the article was “you can’t make money from a food blog.” This was information source #2.
Needless to say, these two information sources were conflicting. As Lindsay and I were talking about this we came up with the idea of doing an experiment to see which information source was right. We called it The Food Blog Money Making Experiment (don’t judge the name…I think we ran out of creative juices by the time we got around to naming it).
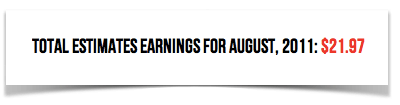
We published the first post in September of 2011 with total earnings of $21.97. Here’s the screenshot from that post (also…don’t judge the fact that it has a typo).
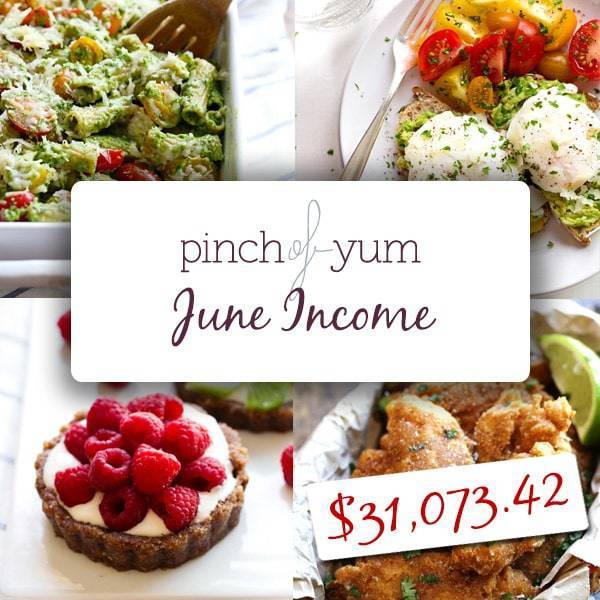
So what happens between $21.97 and $31,073.42?
To be honest, nothing too exciting. We haven’t discovered any secrets, connected with any influential stars, or discovered any shortcuts to success. We are probably inefficient in a lot of the things we do and I’m sure that we’re missing a lot of opportunities to grow the blog beyond where it currently stands.
The one thing that has happened is a lot of posting, commenting, photographing, failing, recipe testing, learning, applying, failing, succeeding, and repeating.
I find Seth Godin’s reflections on his 5,000th post (5,000!!!) to be fitting.
“While it’s tempting to swing for the fences and hit a grand slam, particularly on post 5,000, I’m going to resist, as I try to resist every day. Drip, drip, drip.”
Seth Godin
It’s exhausting to swing for the fences every day. It’s much more sustainable to swing for consistent singles, and sustainable and consistent (and continually improving) are what win the game when you’re building a blog.
With that in mind, let’s take a look at the numbers for June.
A quick note: Some of the links below are affiliate links. All of the products listed below are products and services we’ve used before. If you have any questions about any of the income or expenses you can leave a comment and I’ll do my best to reply.
Income
- Bluehost – $6,325 –> this income comes from a page where we show people how to start a food blog.
- BlogHer – $6,205.23
- sovrn – $6,071.54
- Tasty Food Photography – $3,779.00
- Sponsored Posts/Speaking – $3,150
- Yellow Hammer Media – $2,300.20
- Photography Workshop – $1,500
- Swoop (via BlogHer) – $1,054.17
- Genesis Theme – $852.24
- Ziplist – $801.33
- Google AdSense – $708.90
- Everyday Healthy eCookbook – $593.00
- Recipe and Photo Licensing – $520
- Gourmet Ads – $443.66
- How to Monetize Your Food Blog eBook – $395.00
- The Creamy Cauliflower Sauce eCookbook – $380.25
- Say Media – $205.73
- Elegant Themes – $93.00
- MediaTemple – $80.00
- Thesis Theme – $57.42
- SkimLinks – $44.39
- AWeber – $11.00
Total Income: $35,571.06
*We didn’t have the totals for Swoop at the time of publishing this post, so we took last month’s income and adjusted for traffic.
Expenses
- Support Staff – $892.48
- eBook Affiliates – $888.13
- Food Expenses – $810.58
- Travel – $519.92
- Amazon S3 and Cloudfront – $350.13
- Media Temple (Hosting) – $350.00
- RightBanners – $116.00
- New photography background boards from Etsy – $100.00
- WP Site Care – $99.00
- MailChimp – $90.00
- LeadPages – $67.00
- Adobe Creative Cloud – $53.55
- PayPal Website Payments Pro – $30.00
- ViralTag – $28.00
- Mpix – $23.31
- QuickBooks – $21.56
- Time Doctor – $19.98
- E-Junkie – $18.00
- VaultPress – $15.00
- Google Apps – $5.00
Total Expenses: $4,497.64
P.S. If you’re interested in learning more about some of the ways that you can monetize a food blog, we encourage you to download this free ebook, “16 Ways to Monetize Your Food Blog,” from our sister site, Food Blogger Pro!
Thoughts On Income
Viewability Update
In last month’s report, I talked about an advertising term called viewability. In the report, I shared that the viewability of our BlogHer ads (these are the first ads you see in the sidebar if you’re reading this post on a desktop computer) was really low.
The first step we took to improve the viewability of these 160×600 ads was to move them down the sidebar. This seems a bit counterintuitive, but in last month’s report, I share how this actually can improve viewability.
We moved the ads down by breaking out the tabbed widget dealio we had in the sidebar and giving each tab its own space.
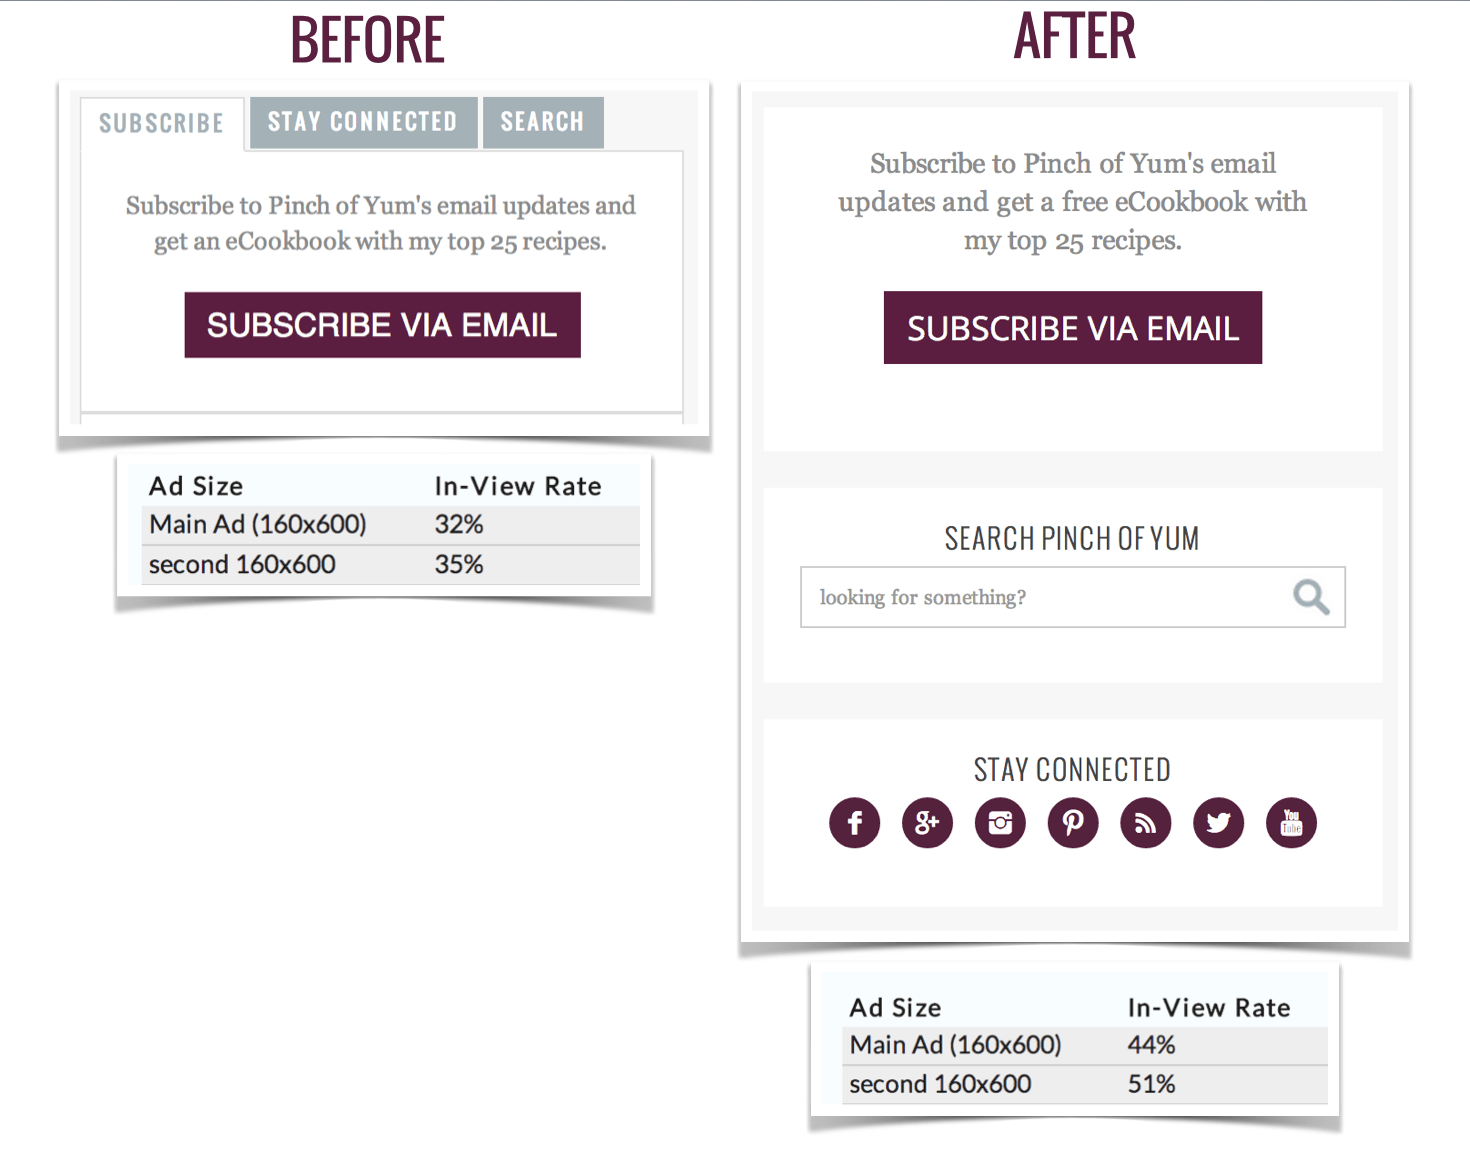
I made this change on July 4th, and since then the viewability has gone up 14% (that’s the average between the two ads). Mission partially accomplished! I say partially because we still have some work to do to get that to a good number, but it’s an improvement nonetheless.
Turn! Turn! Turn! (To Everything There Is a Season)
Do you know that song by The Byrds (or is it Pete Seeger (or is it from the book of Ecclesiastes))?
Regardless, the phrase is true for the advertising industry, but a better way to put it would be like this:
Turn! Turn! Turn! (to Everything There Is a Quarter)
One of the things that took me a while to learn with advertising is that there are advertising quarters that have an impact on the revenue you earn from your blog. Each year is divided up into four quarters.
- 1st Quarter: January – March
- 2nd Quarter: April – June
- 3rd Quarter: July – September
- 4th Quarter: October – December
Advertising spending fluctuates based on which quarter you’re in. It’s not uncommon to see a big change in just 24 hours because of the change from one quarter to another. On the last day of a quarter, advertisers are spending their remaining budget, and when the quarter resets they’re more conservative with their spending.
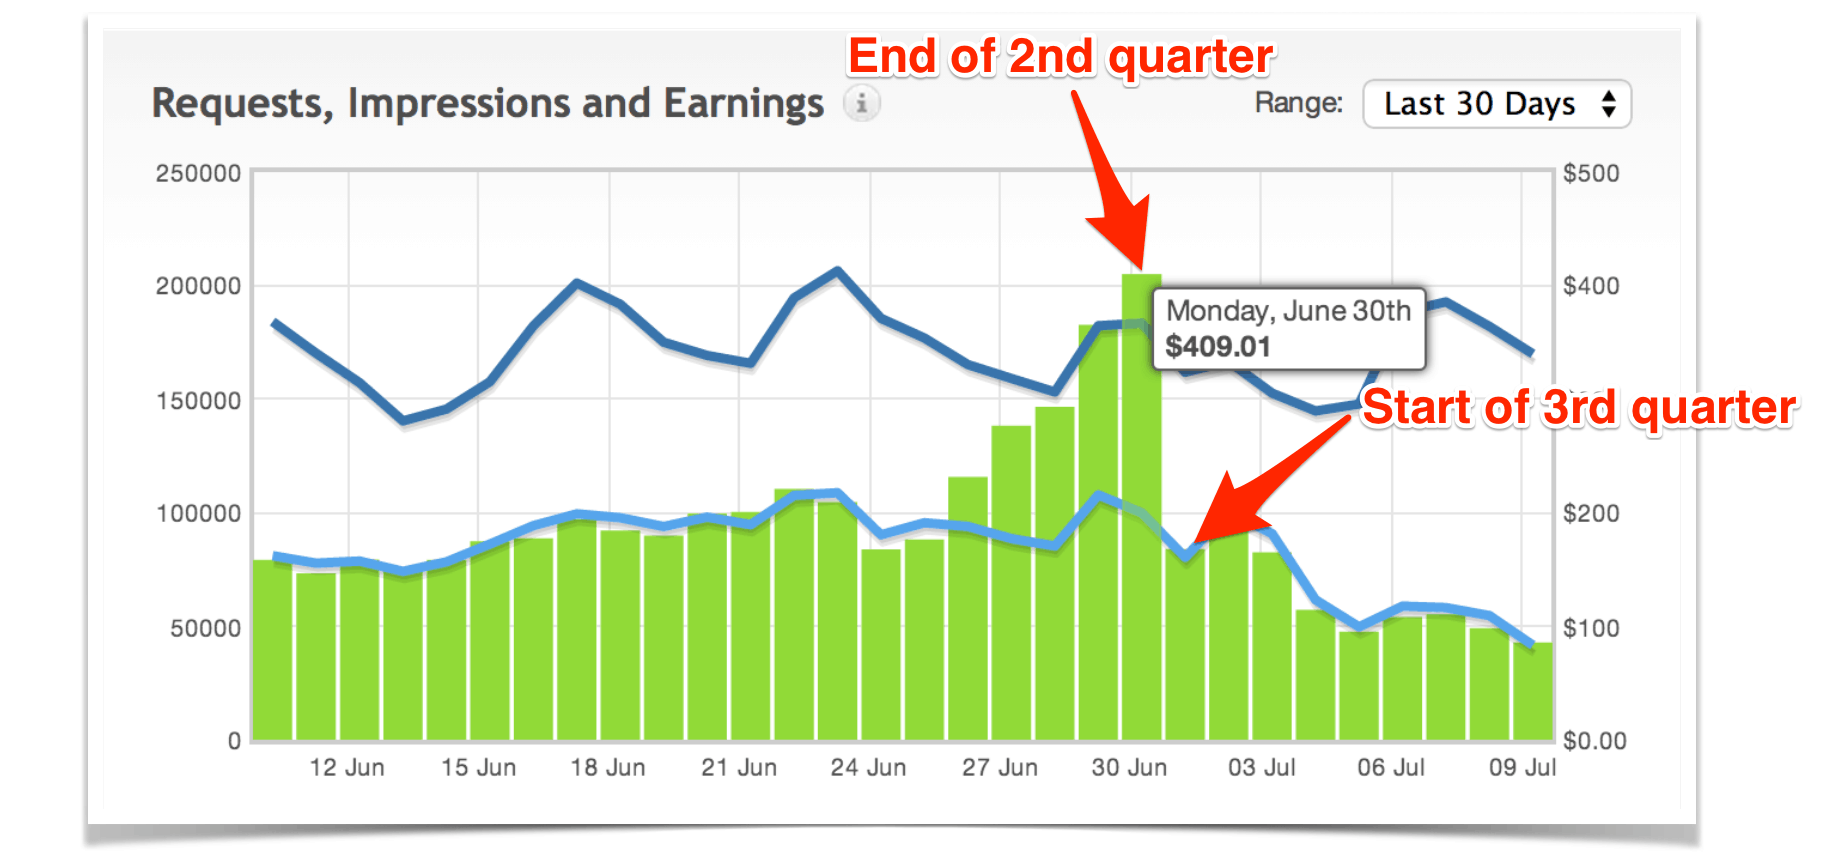
Any ideas which quarter is traditionally the best?
Yep! You guessed it (or maybe you didn’t)…
Quarter four.
Why? Because we’re all spending money on gifts (like a Nintendo Sixty-FOOOOOOOOOOUR for our kids). Quarter four advertising budgets are usually bigger because companies know that people spend more money, which is why you’ll traditionally see higher advertising income in the fourth quarter of the year.
So how does this knowledge help you grow your food blog?
Hopefully, with this knowledge, you’ll be less like to stress out if your ad revenue drastically changes from one quarter to the next, and less stress = more productivity, and more productivity = more awesome content, and more awesome content helps you grow your blog.
A Simple Way To Improve Your Blog’s Earnings

When I was in college (Go Gophers!) I figured out what I considered to be a pretty nifty “life hack.” When I’d start a new semester I’d ask my professors if they’d be willing to provide feedback on the papers I was required to write for their class. The answer was usually yes, provided I could get the paper to them in time for them to read through it.
When a new paper was assigned I’d aim to finish it a week before the due date so I could print it out, bring it to class, and ask for their feedback. They’d look through the paper, offer some ideas for improvements, and a week later I’d turn in the paper with the updates made. I was never great at writing papers, so it was a simple way for me to give my grades a boost.
It really came down to this: asking.
Your blog can benefit from doing the same. Just ask.
I’ve used this strategy (if you can call it that) quite a few times and it’s usually resulted in an increase in revenue for the blog.
Are you an affiliate for a certain company’s product? Email the affiliate manager and ask how other people have successfully created an income from promoting their product.
Do you work with ad networks? Email (or better yet, call) the support desk and ask if they have any advice for increasing your revenue.
I wrote a post back in March about how we increased Pinch of Yum’s monthly income by $1,500 using the “just ask” strategy.
Rpm
RPM stands for page revenue per thousand impressions. Or, in other words, RPM shows you the average revenue you earn from every 1,000 page views on your blog. It’s a helpful metric because it allows you to see how effective you are at monetizing your blog.
If you have 5,000 page views in a month and you earn $100, then your RPM is $20 (for every thousand visitors, you’re earning $20). If you have 1,000 page views in a month but still earn $100, then your RPM is $100 – even better!
Below is the RPM that we had for Pinch of Yum in the month of June.

If you want to learn more about RPM (and some other important advertising terms) then be sure to check out this post on Food Blogger Pro.
Traffic
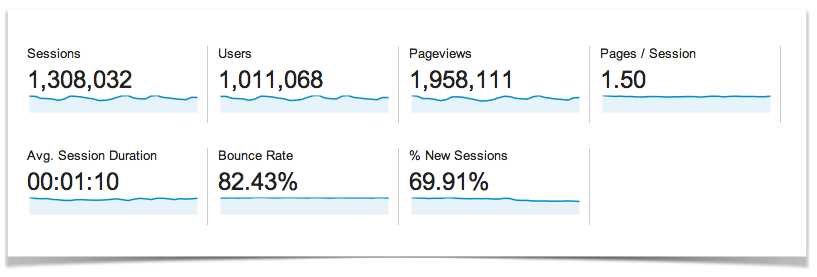
Below are some screenshots from Google Analytics. You can click on these images to view a larger size.
Traffic Overview
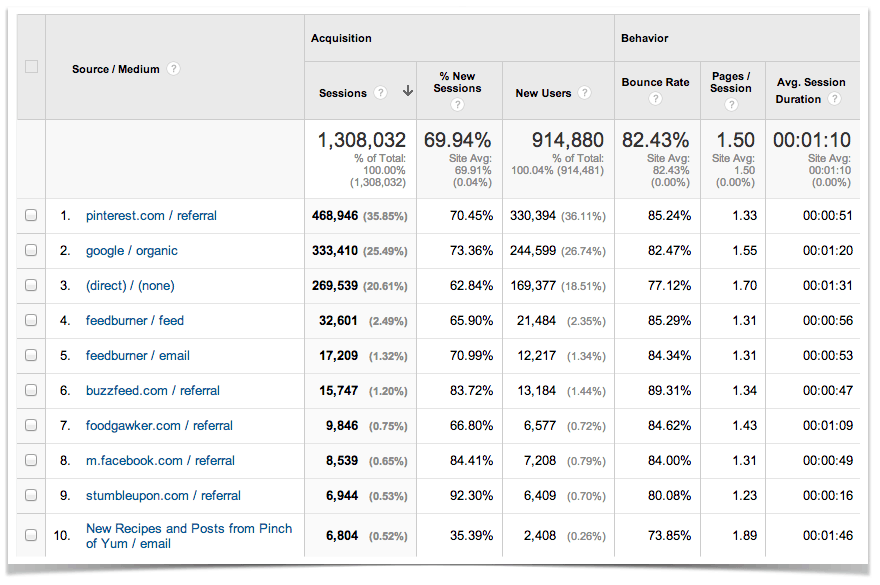
Top Ten Traffic Sources
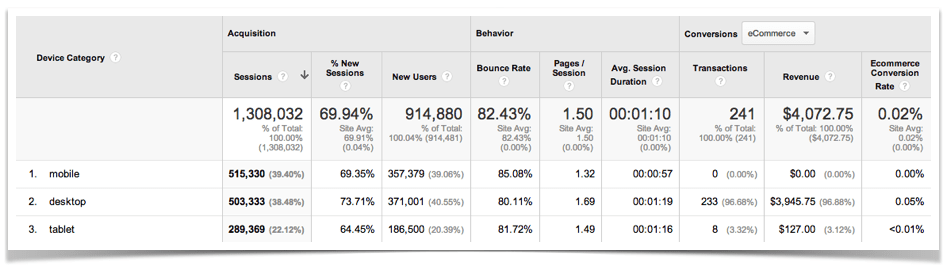
Mobile Vs. Desktop Traffic
Thoughts On Traffic
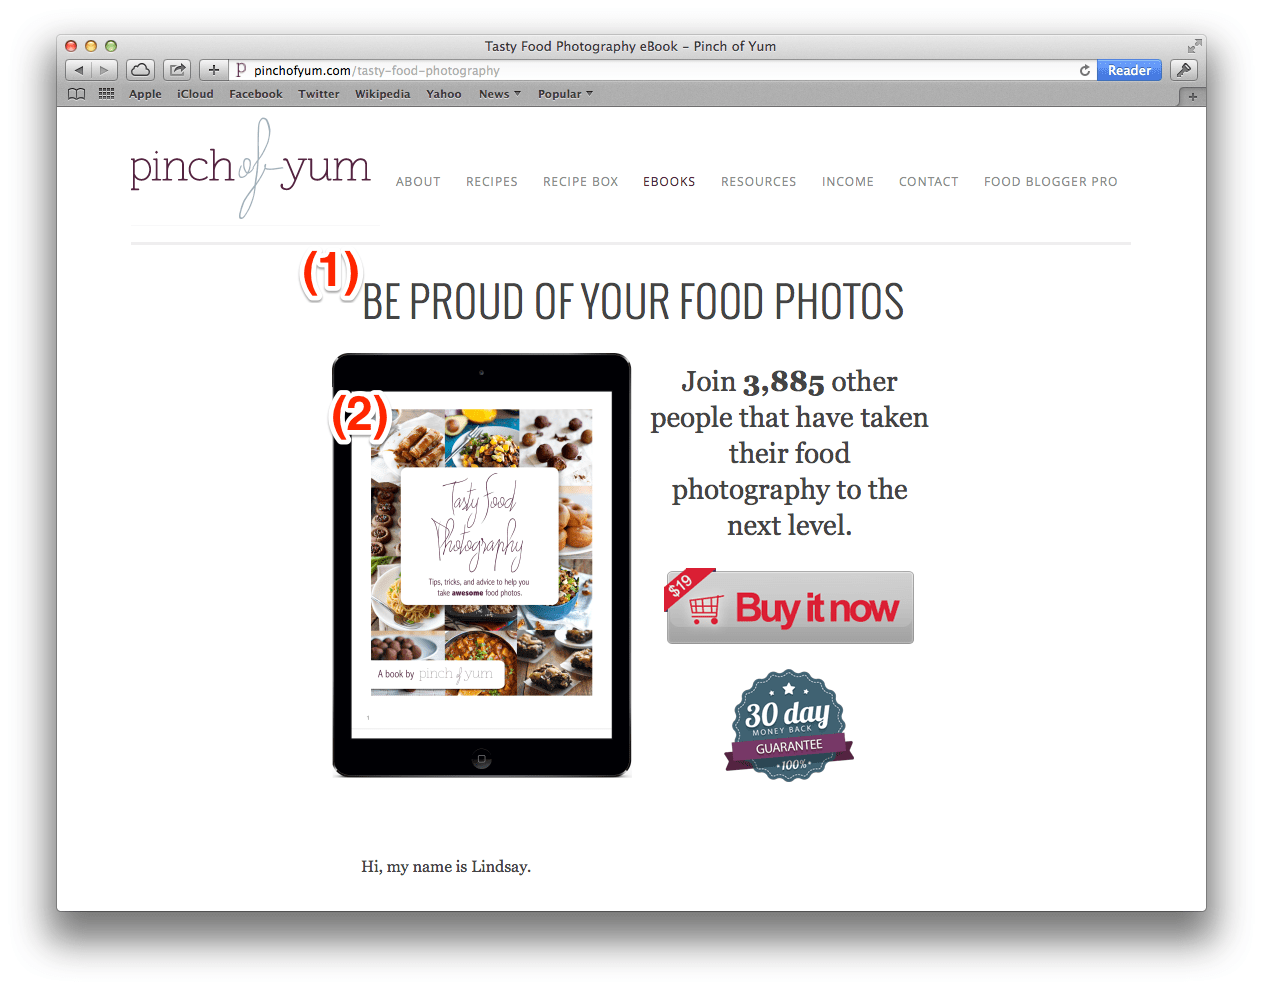
A/B Testing Tasty Food Photography Page
I’m really pumped about this update!
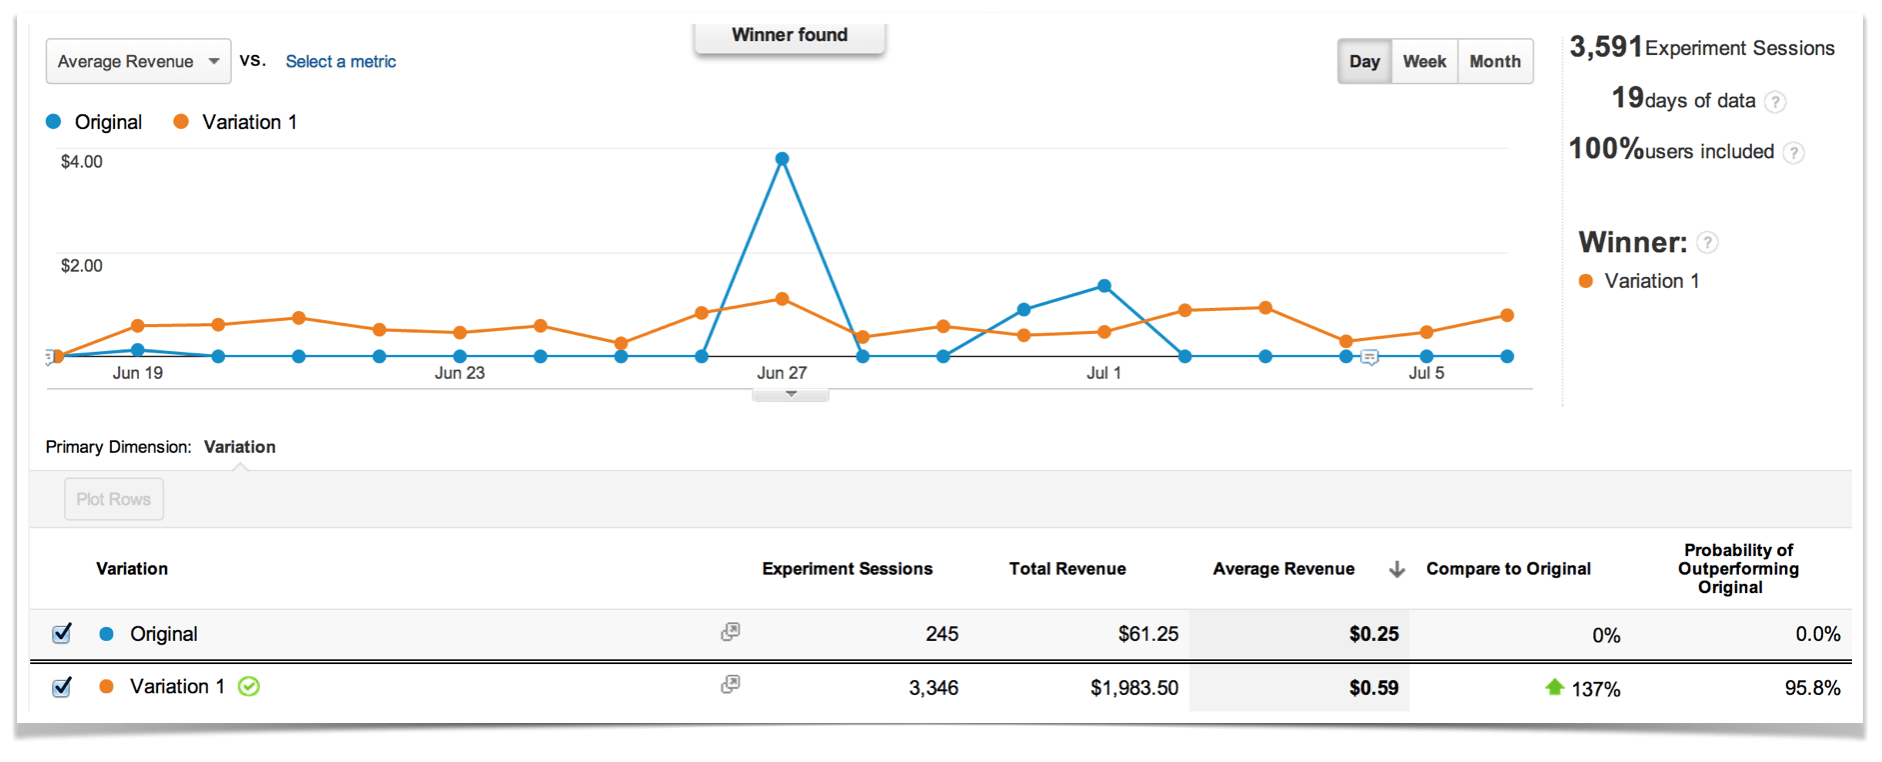
We just closed out a successful A/B test on the Tasty Food Photography sales page. The conversion rate of the test page was 137% higher than the original.
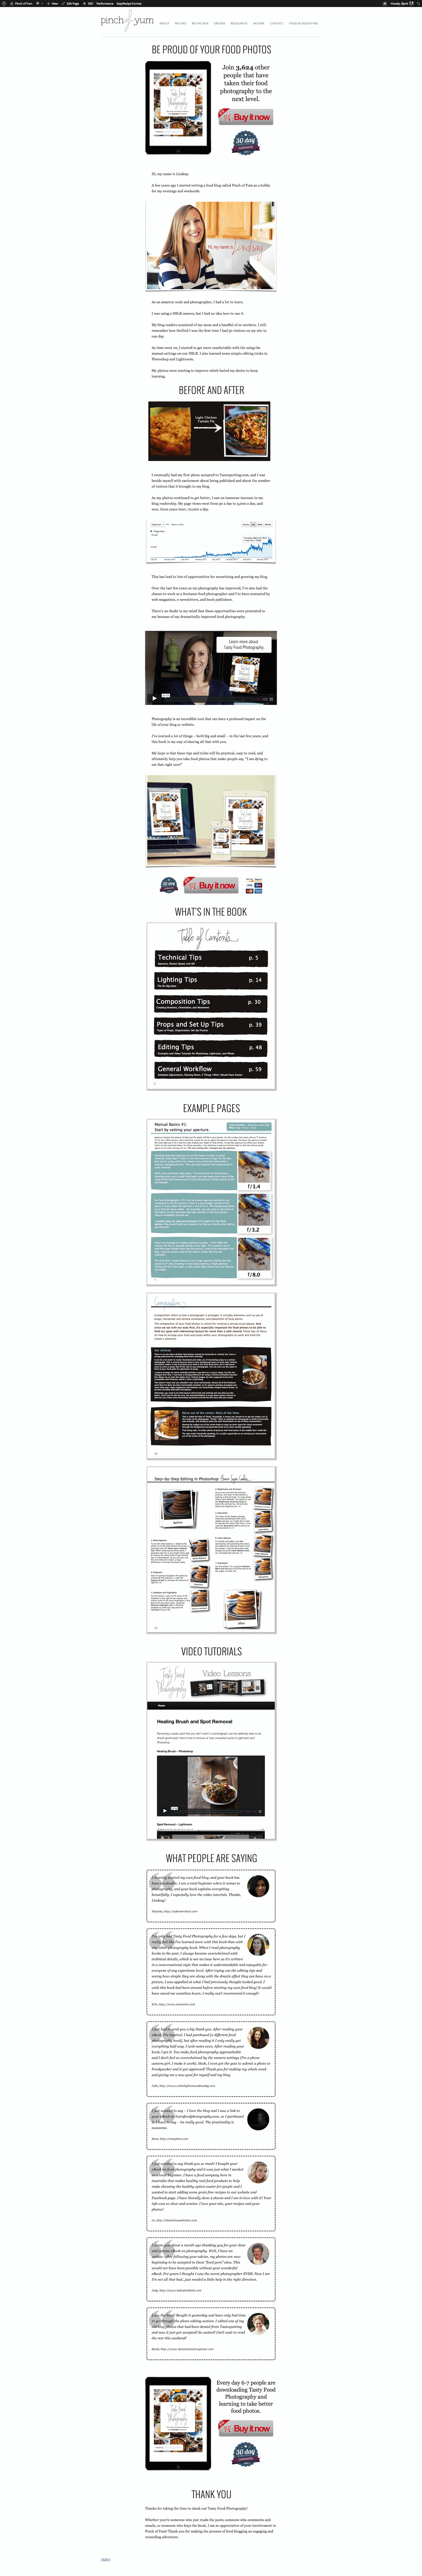
Here are the test results (you can click to view the full-size image of the screenshots below):
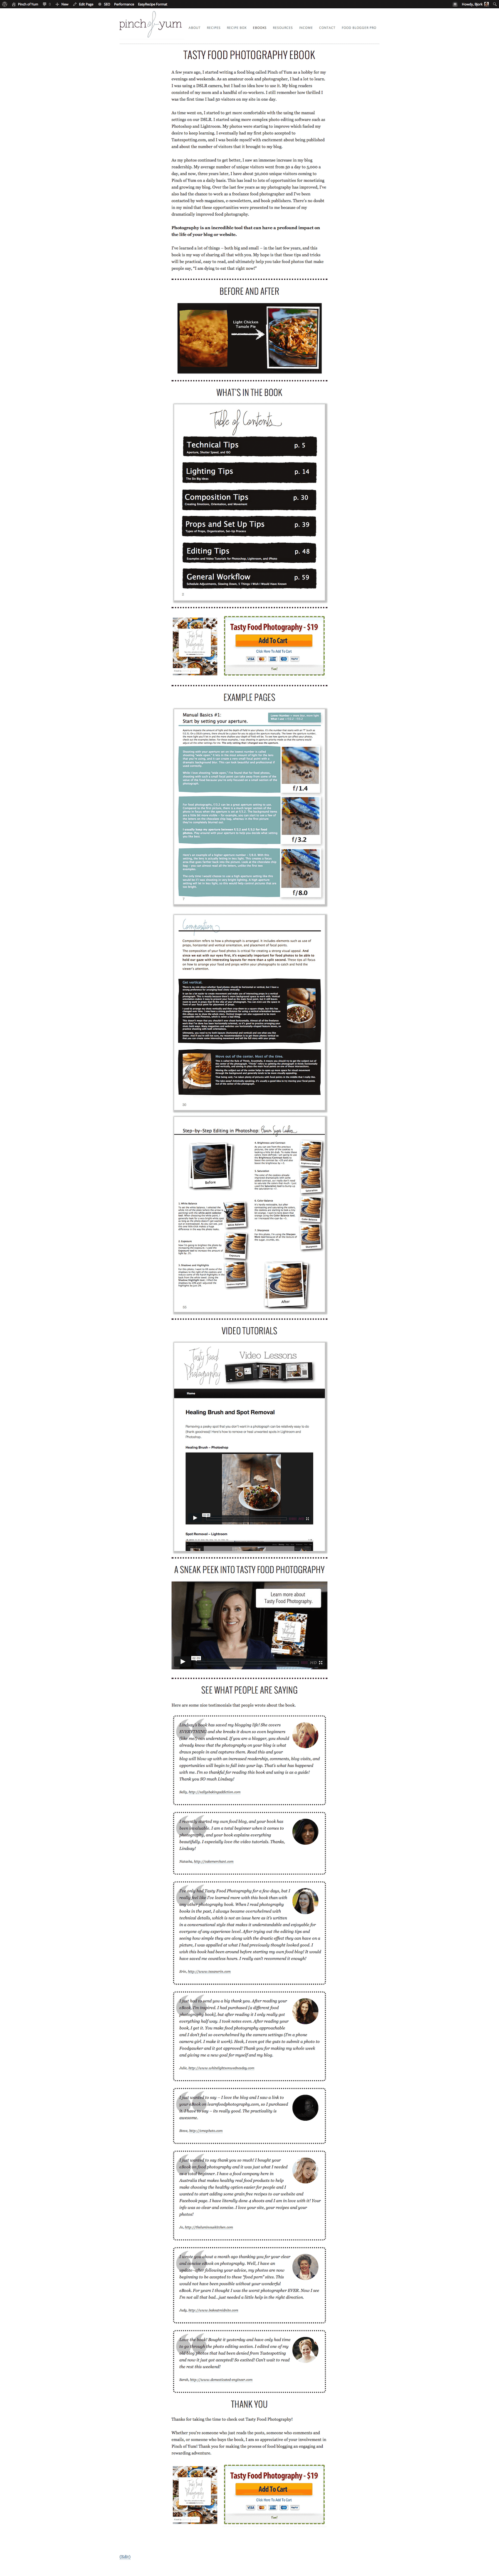
- Click here to view the original sales page.
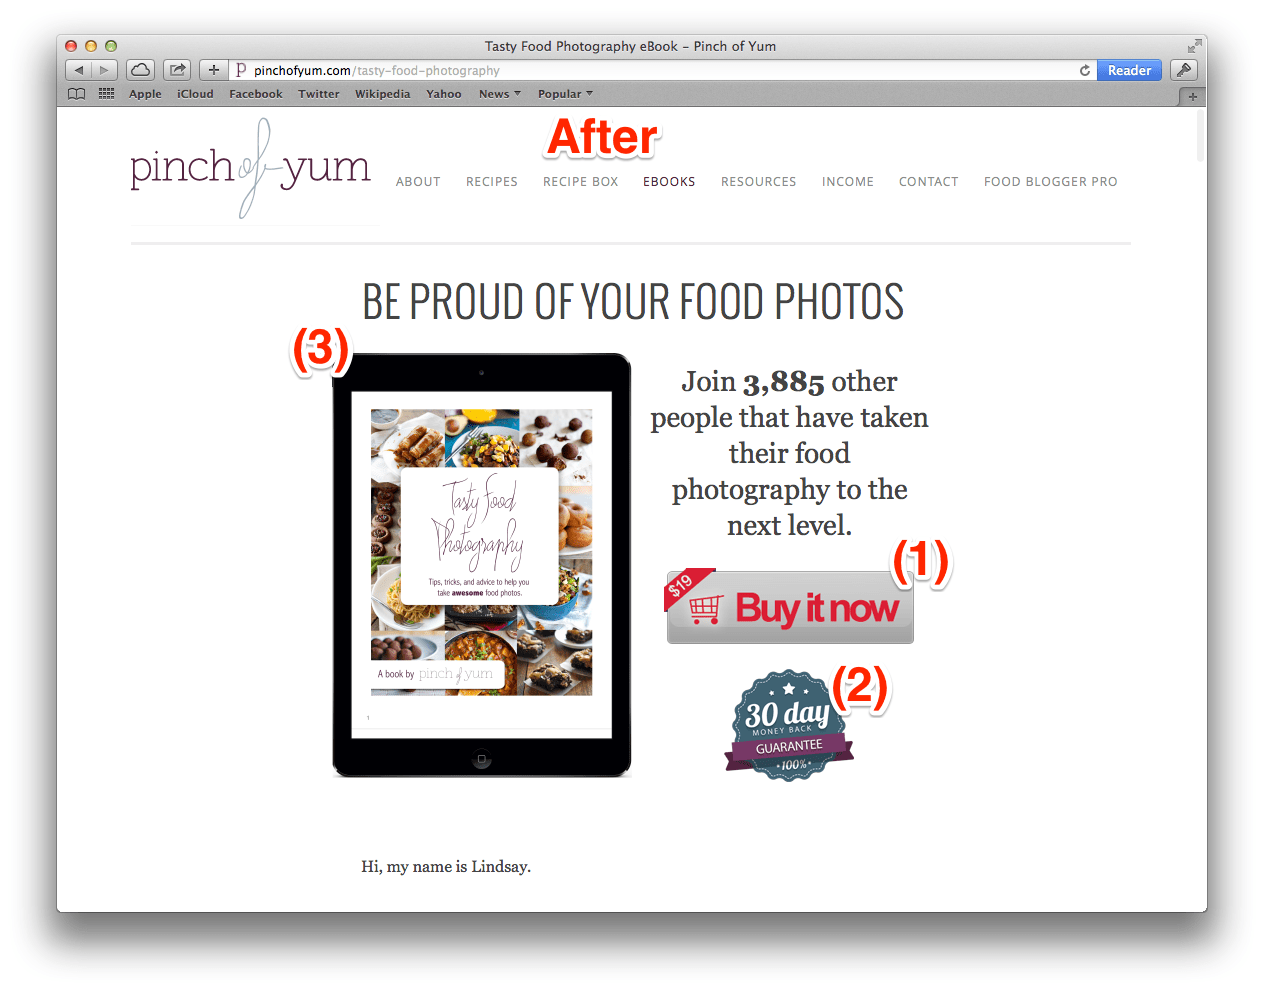
- Click here to view the variation sales page.
We actually just closed out a different A/B test for Food Blogger Pro (with really similar results). I wrote a detailed post on the FBP blog called How we improved our landing page conversion rate by 138%. The post breaks down some of the details about how these experiments work and what the different metrics mean.
Here is a basic breakdown of some things that we did to improve the conversation rate. If you have a product that you sell (or are going to have one someday) then you should take note of these things so you can implement them in your sales page.
4 Things We Did To Increase Conversions On Our EBook Sales Page
1. We added a (1) buy now button, (2) 30-day guarantee badge, and (3) product image above the fold.
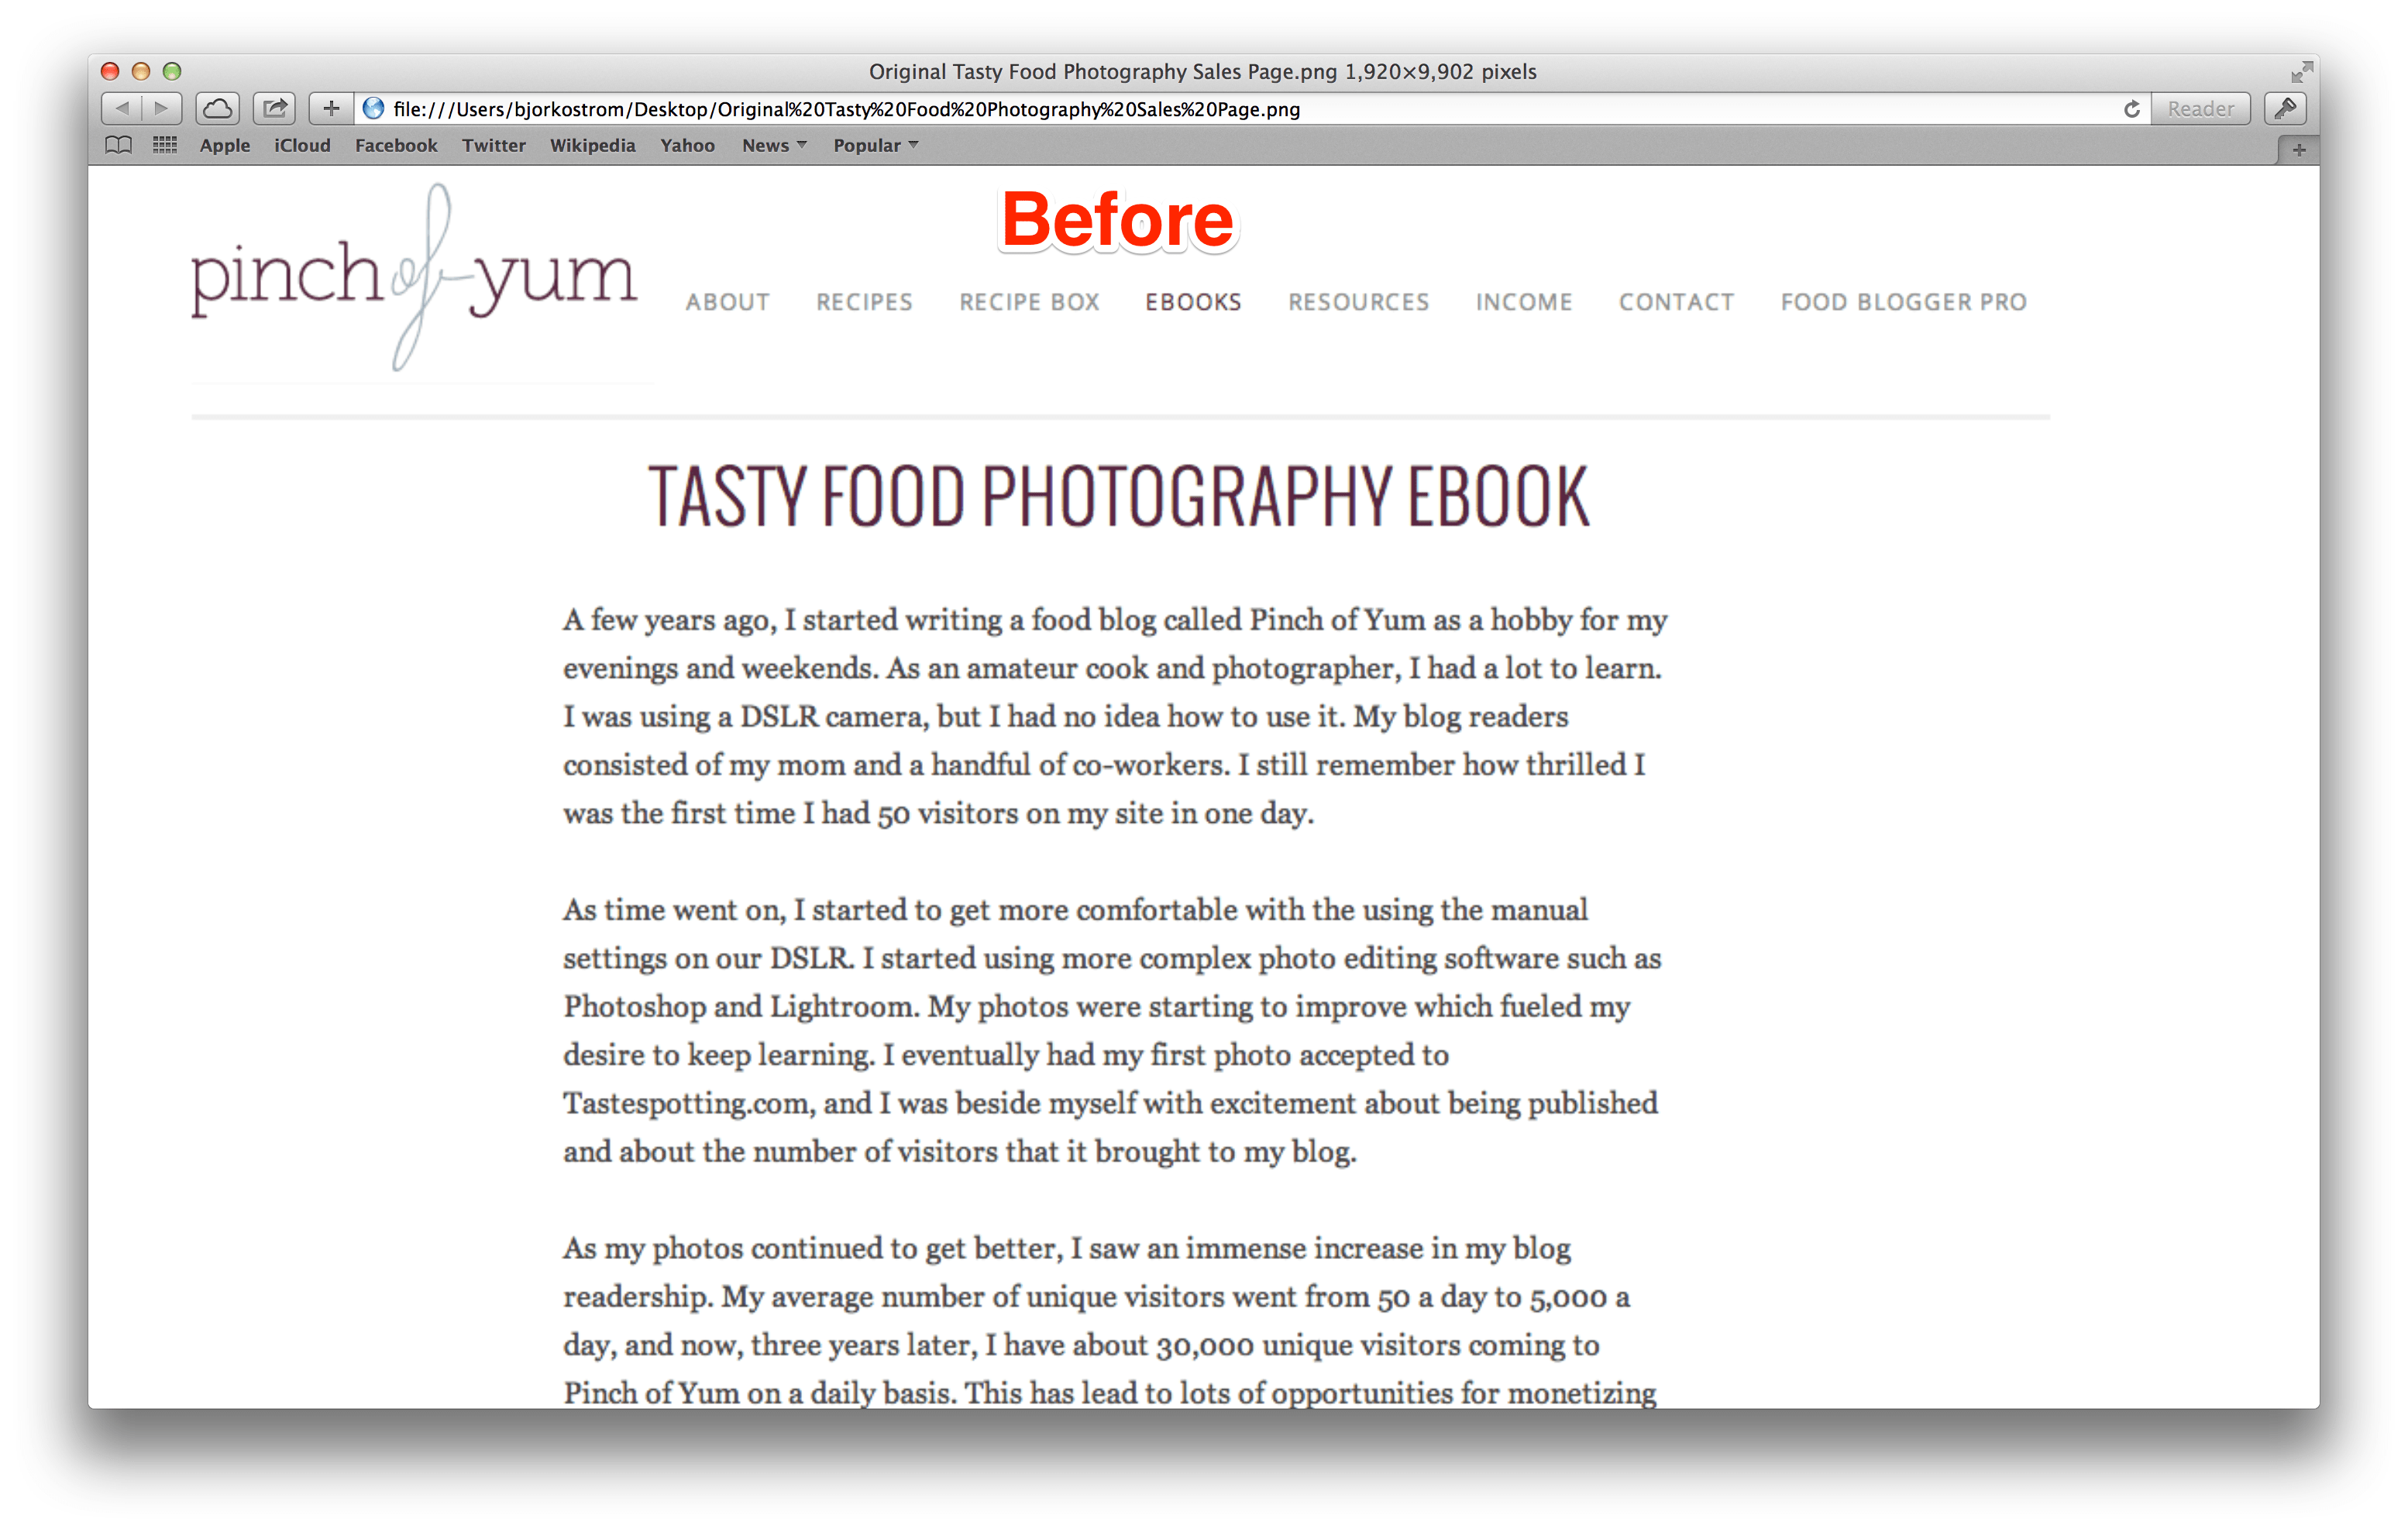
As you can see, the only thing on the sales page before was text. Let me say that again: It was only. text. Eesh. What a terrible mistake. :/
Here’s why that was a mistake:
- It’s a book about photography and the only thing people saw at first was text.
- Studies show that 80% of viewing time on websites is dedicated to above the fold content. Our buy now button was below the fold, where only 20% of viewing time occurs.
- There was nothing intriguing about the text that would encourage users to scroll down to the content below the fold (where the buy now button was).
Jakob Nielsen, a User Advocate and principal of the Nielsen Norman Group, sums it up in a summary of a study he conducted:
“The implications are clear: the material that’s the most important for the users’ goals or your business goals should be above the fold. Users do look below the fold, but not nearly as much as they look above the fold.
People will look very far down a page if (a) the layout encourages scanning, and (b) the initially viewable information makes them believe that it will be worth their time to scroll.
Finally, while placing the most important stuff on top, don’t forget to put a nice morsel at the very bottom.”
Jakob Nielsen
As you can see in the quote, it’s also important to include your call to action at the bottom of the page. We made sure to include this as well.
2. We strengthened our conversion coupling.
I learned this one from Oli Gardner in an article he wrote for Moz called The Most Entertaining Guide to Landing Page Optimization You’ll Ever Read. It’s a bit crass, but it’s indeed entertaining. It’s also educational.
In the post, he talks about a term called conversion coupling.
Conversion Coupling: the bond that exists between the source of a click and the ensuing landing experience.
The two changes we made to strengthen our conversion coupling was to (1) change the header text of the landing page to read “Be Proud of Your Food Photos” and (2) include a cover image of the eBook.
Both of these changes helped the landing page match the affiliate ads that people use, thus strengthening the page’s conversion coupling.

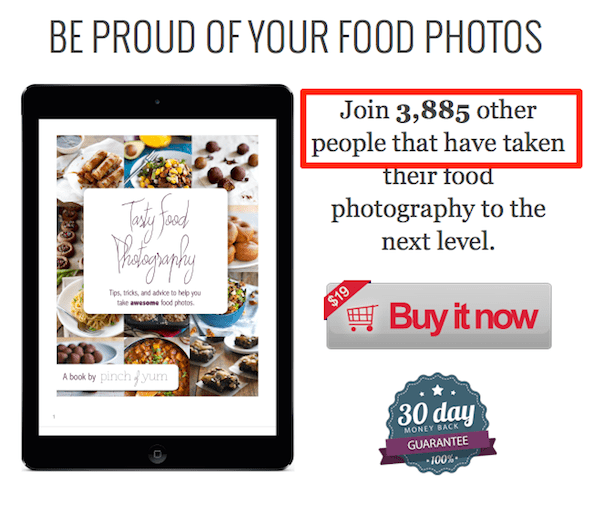
3. We leveraged social proof.
Buying a product online is a complicated process.
Not technically complicated, but mentally complicated. Internally we’re asking ourselves a slew of questions about whether a purchase is a good or bad idea.
- Will I regret this?
- Will this help me?
- What will people think of me if I buy this?
- Is this safe?
- Will I get ripped off?
- etc, etc, etc…
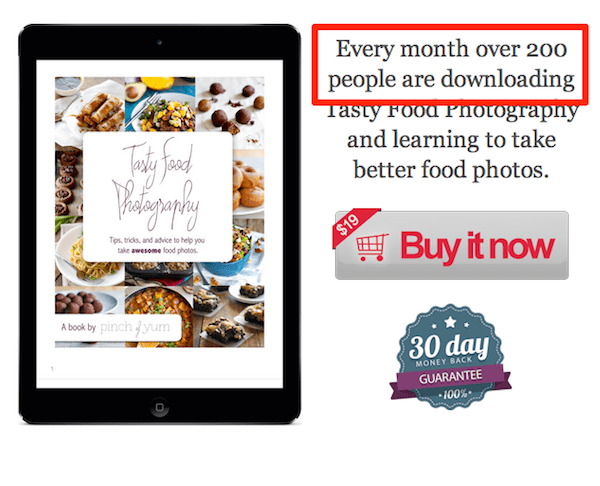
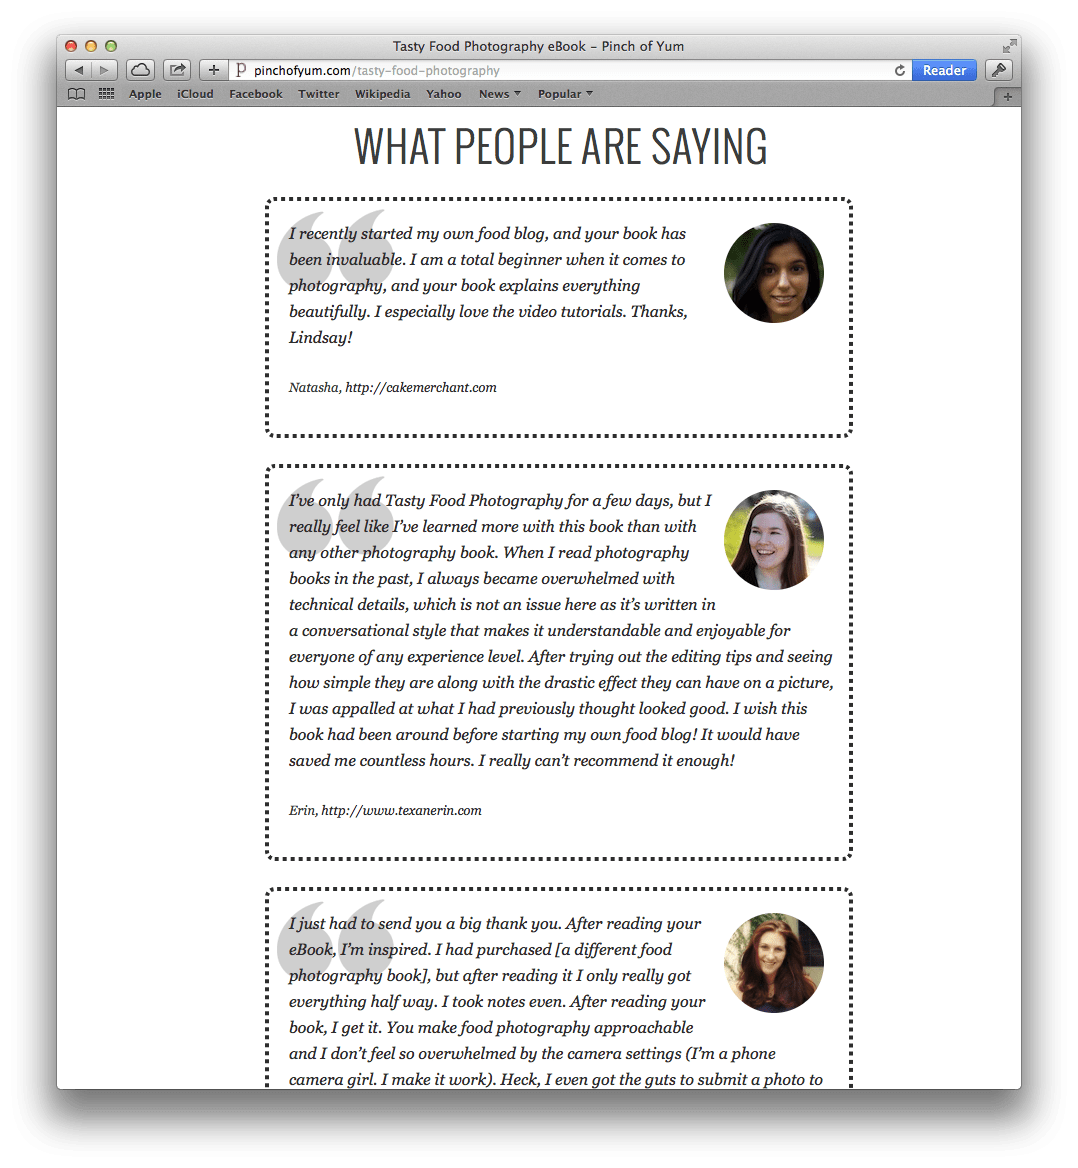
Social proof is one way that you can help visitors feel more confident about their purchase. We use social proof in three places.
Social proof placement #1 – Overall sales numbers (above the fold)
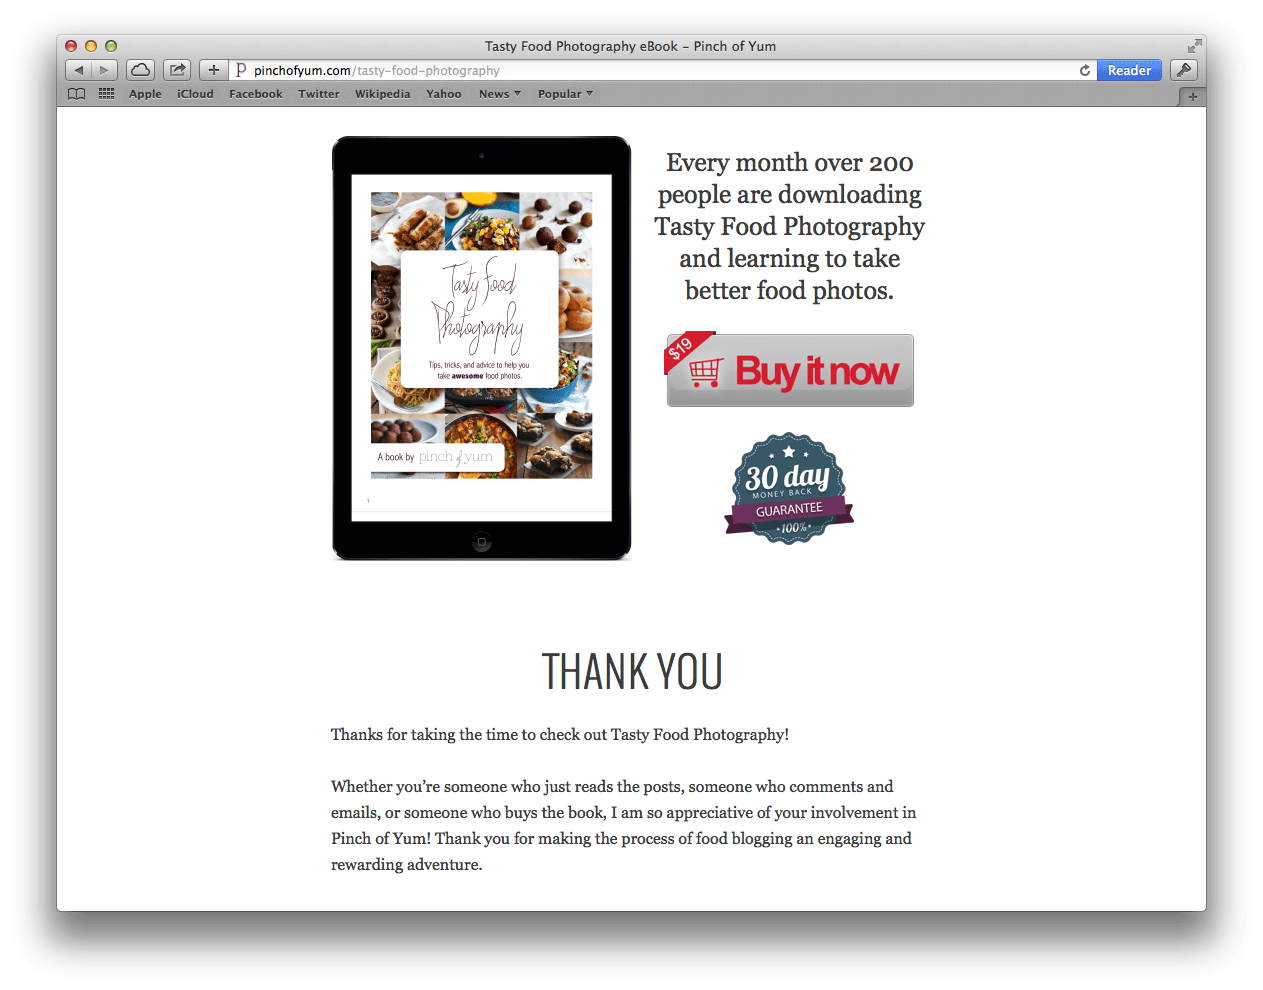
Social proof placement #2 – Monthly sales numbers (below the fold)
Social proof placement #3 – Testimonials (this was carried over from the previous sales page)
And finally, the last significant change we made to help increase conversion rates was…
4. Showcasing Lindsay
The new landing page does a better job of showcasing (the beautiful!) author. This helps to show the personality behind the product.
I couldn’t find any research that shows how including a personal photo impacts conversion rate, but I have a gut feeling that it does.
If you’re interested in learning about the process we used to do this A/B test you can read the How to Increase Your Conversion Rates with A/B Testing post on the FBP blog.
Other Income Reports

I’ve gotten some emails and read some posts on the FBP community forum about other bloggers writing income reports. It’s so fun to see!
If you’re doing an income report (or something similar) could you post a link to the category URL of those posts? For instance, this would the category link for our reports: https://pinchofyum.com/category/making-money-from-a-food-blog
I think other bloggers would like to read through the different reports, and it might help you get some followers as well. Thanks!
Because Of You
It’s really true. It’s because of you (yes, you!) that this thing we call Pinch of Yum can exist as it does today. Thanks so much for reading, tweeting, commenting, emailing, and sharing these recipes with your families and friends. We love hearing from you!
We’re using a portion of this month’s income from Pinch of Yum to support one of the special projects at the Children’s Shelter of Cebu, an incredible orphanage in the Philippines where Lindsay and I lived and worked for a year.

This month we’re supporting the Children’s Shelter of Cebu by purchasing some school uniforms for the upcoming school year. You can learn more about CSC’s special projects by visiting this page on their website.
The post June Traffic and Income Report – $31,073.42 appeared first on Pinch of Yum.